Flow Analysis
The evaluation function Flow Analysis can be accessed from the Task Menu. The entire layout is grayed out, so that only the flows are displayed in color.
Interaction Options
Once Flow Analysis is activated, only flow arrows and resources that are sources or sinks can be selected in the layout area. Moving any objects is not possible, and there is no dynamic menu.
The following questions about flow relationships can now be answered by interacting with the 2D layout:
- Which source and which sink belong to a flow?
- Which flows belong to a resource?
- Which resources form flow relationships?
These are particularly useful for complex flow relationships, as flows on the same path segments in the layout area (2D) are displayed overlapping. The exact path of a flow between its source and sink and all related questions can be difficult to visually capture in 2D in these cases.
2D vs. 3D
Flow Analysis refers to the layout area, i.e., the 2D view. Activating this function does not generate a parabolic representation in the visTABLE®3D view.
Determining the Path, Source, and Sink of a Flow
To analyze a flow, select its flow arrow in the layout:
Procedure
- Start the
Flow Analysisfrom the Task Menu. - Select the flow to be analyzed in the layout area by tapping or left-clicking on the flow arrow.
- If multiple flow arrows overlap at the point of interest, tap repeatedly until the desired flow is highlighted through an animation.
Tip: Increase the zoom level and tap near the axis or the imaginary centerline of the flow arrow if the desired flow is not highlighted. Use Fit Zoom to display the selected flow relationship fully centered on the screen.
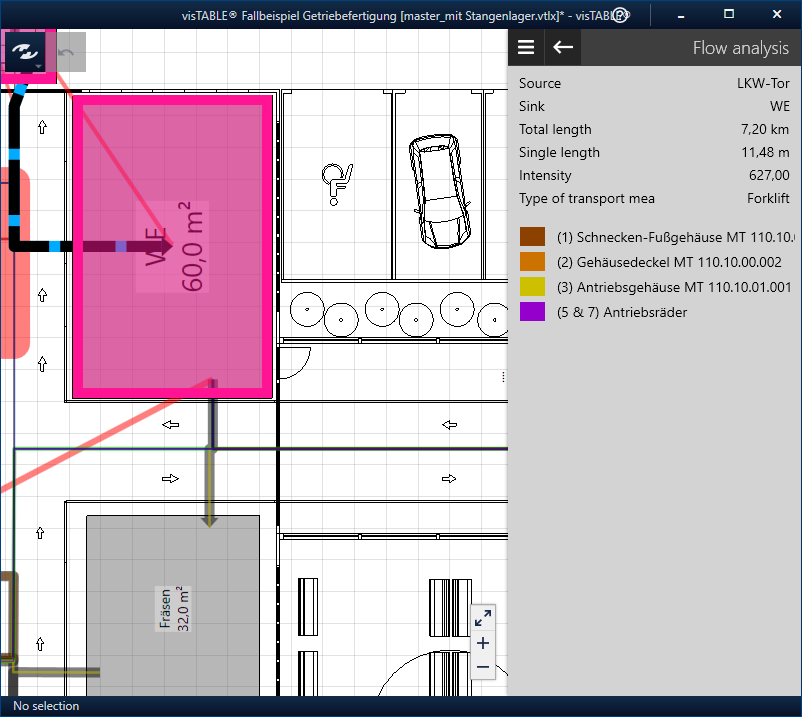
Result
Selecting the flow arrow highlights the bounding boxes of the associated source and sink in the layout area with a pink frame. In the Task and Tool Area, you will receive the following information about the selected flow:
- Name of the source
- Name of the sink
- Total path (corresponds to the transport effort when using the transport quantity intensity measure)
- Simple length between the material flow attachment points of source and sink
- Intensity of the selected flow
- Transport type used to realize the flow
- Name(s) and color coding of the product family/families involved in the flow
Determining the Flows and Flow Relationships of a Resource
To analyze the flow relationships of a resource, select it:
Procedure
- Start the
Flow Analysisfrom the Task Menu. - Select the resource of interest in the layout area by tapping or left-clicking.
Tip: Make sure not to select the resource at a point where a flow arrow runs, otherwise the flow will be selected. Increase the zoom level if necessary. Use Fit Zoom to display the selected flow relationship(s) fully centered on the screen.
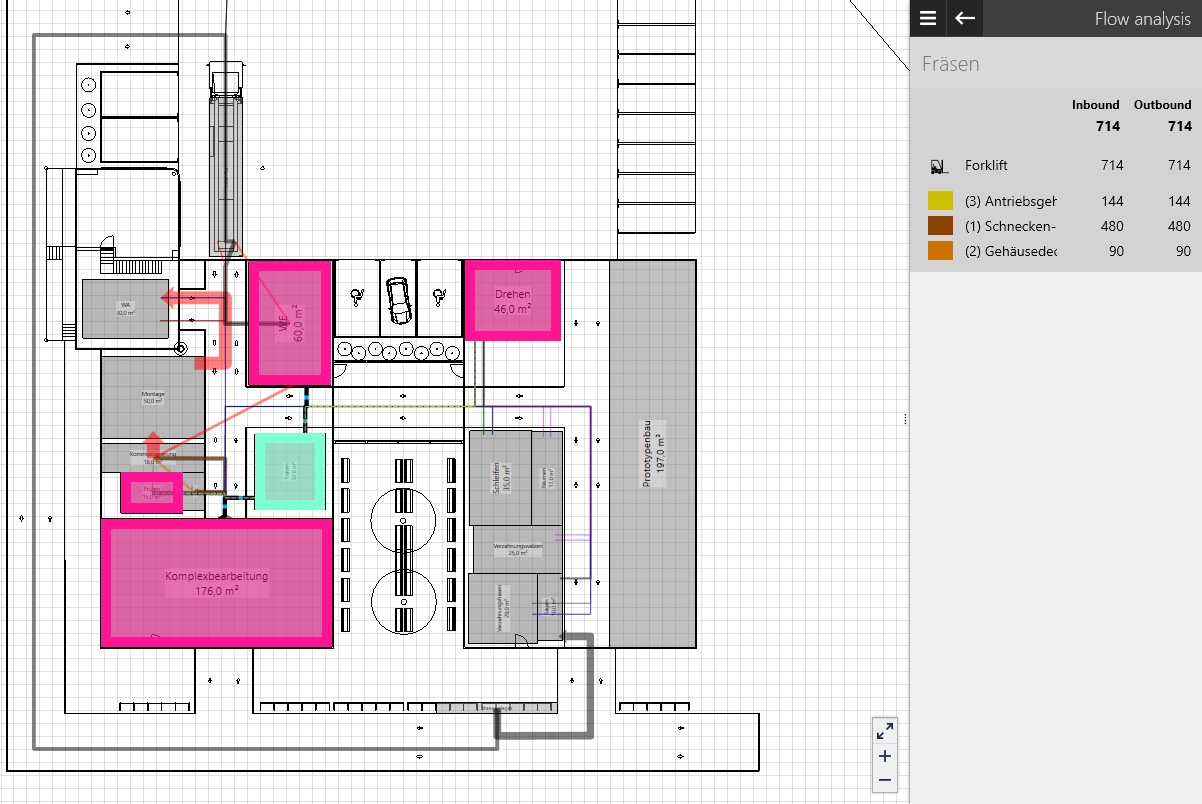
Result
Selecting the resource highlights it with a green bounding box. The resources involved in its flow relationships are marked with pink bounding boxes, and the associated flow arrows are animated in the direction of the flow. In the Task and Tool Area, you will receive the following information about the selected flow:
- Name of the selected resource (displayed at the top in larger font)
- Sum of the incoming and outgoing intensities of this resource, with intensity breakdown by:
- Transport types (indicated by a transport type icon)
- Product families (indicated by the color coding defined for the product family in visTABLE®logix)
- Transport types (indicated by a transport type icon)