Evaluate Logistics
In order to be able to qualitatively evaluate the design solution for process and layout under logistical aspects, the logistics evaluation calculates key figures for the transportation effort or transportation costs based on the current layout status. To do this, transports and means of transport cost rates must be defined via visTABLE®logix. Alternatively, transportation information from imported transportation tables or a transportation matrix can serve as a database.
A change in the layout or process created in the planning process immediately leads to a change in the diagram and in the calculations:
- An increase in effort/costs is shown by a red indicator.
- A reduction in effort/costs is shown by a green indicator and a negative sign.
Percentage changes are shown at least under details if at least
- a transport route is lengthened or shortened (e.g. by moving resources or their material flow connection points or changing the course of transport networks).
- an intensity value of a transport changes (e.g. by changing lot sizes).
- the use of means of transport types changes (e.g. swapping the type of means of transport for a shipment).
Basic principles and information on the meaning, recording and visualization of flow relationships can be found in the Material flow help chapter.
User interface

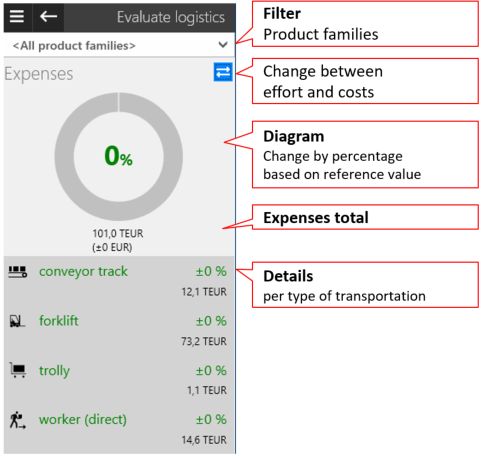
Filter
The filter at the top allows you to filter the flows by Product Families. A number of product families can be selected via the dropdown. The filtering has an influence on
- the display of flows in the layout (2D and 3D) and
- the calculation results (diagram and details) of the logistics evaluation.
Diagram
The diagram shows the percentage change referred to the reference values. The efforts in transportation (as the total of all flows) are specified beneath the indicator. The changes compared to the previously set reference values are specified beneath and put in brackets. Use Reset to accept the reference values from the current layout, allowing a comparison on the basis of the current layout.
- An increase in the efforts/costs is represented by way of a red indicator.
- Reductions in the efforts/costs are represented by way of a green indicator and a negative sign.
Details
All currently used types of transport means are listed beneath the diagram with specification of:
- Designation of the type of transport means;
- Changes in the efforts for all flows of the appropriate type of transport means as a percentage;
- Total distance: Total of all distances multiplied with the appropriate frequency of all transports between the resources for all flows of the appropriate type of transport means.
- Single length: Corresponds to the total in meters of all transports for all flows of this type of transport means when counted only once. In other words: It does not take into account the transport frequency, but evaluates each transport relation with the single length between the resources involved.
Switch between efforts and costs
Can be used to switch the logistics assessment between the efforts on transportation and transportation costs. The prerequisite for this is that cost rates have been defined for the means of transportation in visTABLE®logix.
Values, indicators and details are specified in accordance with the selected scores for transportation efforts and costs.

Notes on the use of imported material flow data from a table or matrix
If transportation tables or a transportation matrix are used as the source of the transportation intensities, the logistics evaluation calculates the transportation costs on the basis of the cost rates that were recorded in visTABLE®logix before the material flow data was imported. When using the matrix, only the means of transportation type Other is available.
Reset
The comparison is based on reference values that refer to a previous state of the layout and were determined at that time. To use the current state as the starting point for future comparisons, click Reset. Confirm the current state with Ok.
The Reset action is only available if
- the transportation costs are displayed (not the cost evaluation) and
- all product families are selected in the filter.
Saving the reference values
The current reference values are saved with the layout document. For a new layout document, the reference values result from the status when the logistics evaluation is opened for the first time. This has the effect that the diagram and calculations may output values based on an unintentionally created layout status when the task area is opened for the first time. In this case, reset the evaluation.
Assess logistics and compare variants
Once any modifications to the layout (moving of resources, modification of transport networks) have been made, the corresponding flow relationships are recalculated automatically, resulting in (new) efforts in transportation.
The following section describes how to create and compare layout variants to each other. The objective is to reduce the efforts in transportation and an assessment of the effects on the transportation costs.
Prerequisites
A logistics assessment is always based on the Production Program for the Layout Area. Logistics assessment can only be used if at least one flow results for it.
Procedure
- Switch to the task area
Evaluation>Evaluate Logistics. - Check that
Effortsis selected as the assessment criterion. Switch fromCoststoEffortswhere necessary. - Use the
Resetcommand to take into account the reference values of the current layout as the basis. The indicator approaches 0%. The current total expenditures are specified beneath the indicator. - Modify the layout and check how the indicator changes. The objective is to reduce the overall expenditures which can be seen in the diagram.
- Take into account changes of the individual types of transport means where appropriate (beneath the diagram).
- Switch the assessment criterion to
Costs: To this end, use the switch in the top right corner. Assess the current costs and their changes with reference to the initial variant. - This procedure is to be performed iteratively and with consideration of further KPIs and criteria.
