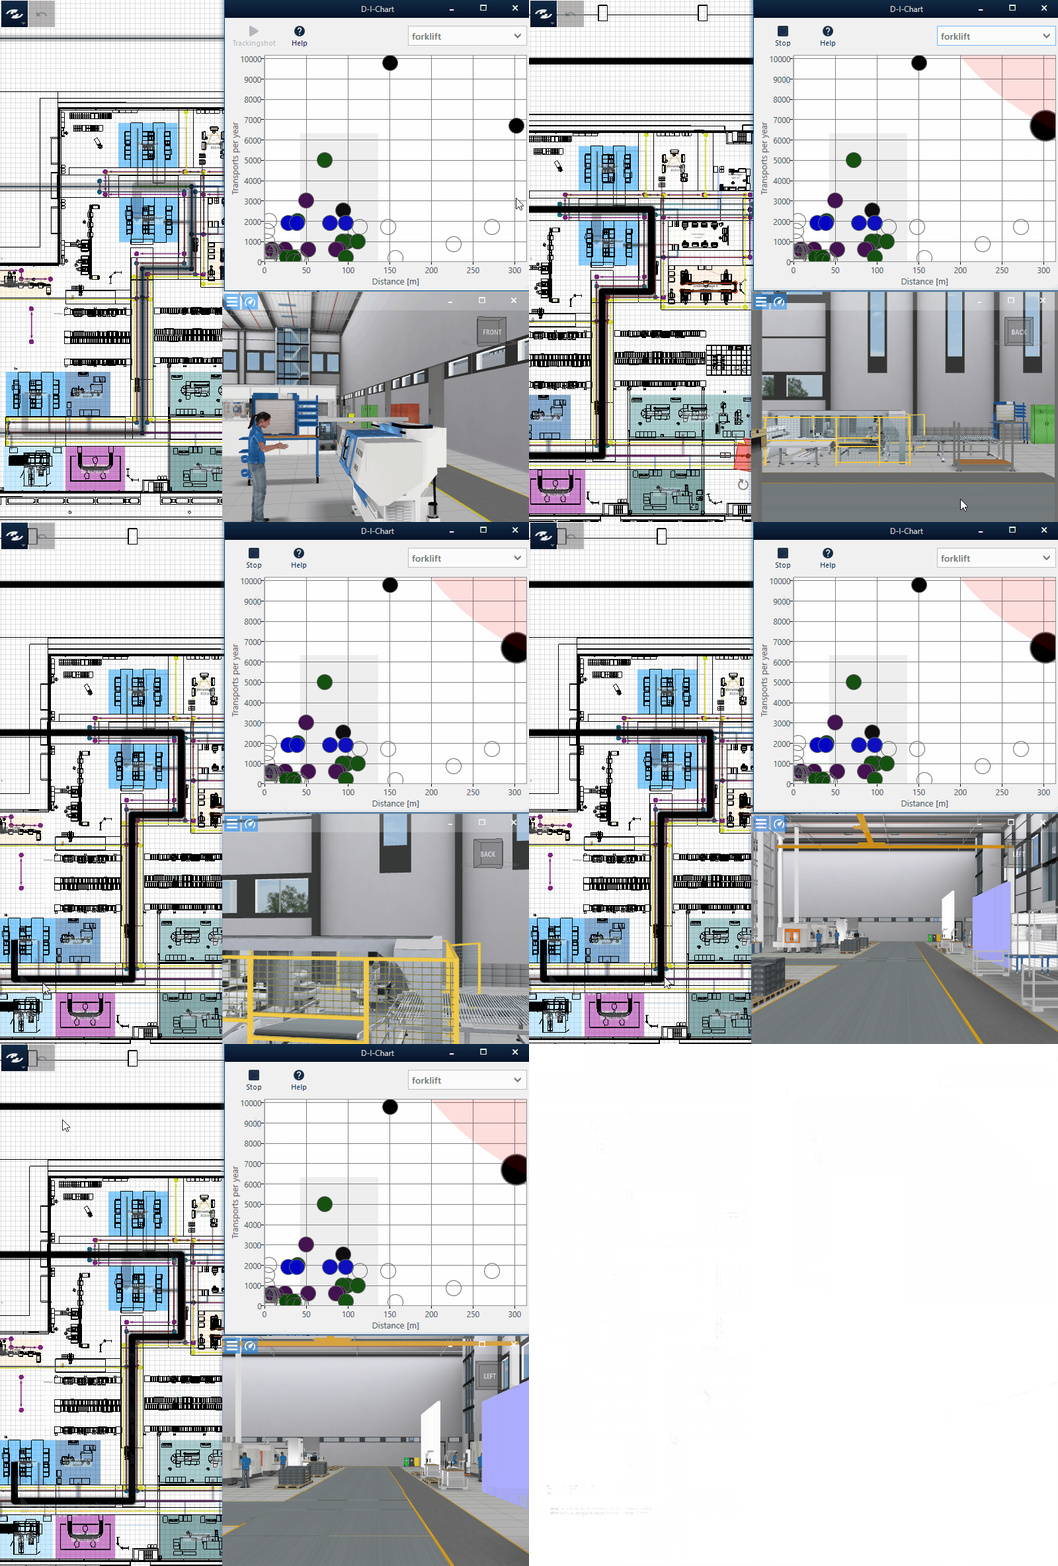
Distance-Intensity Chart
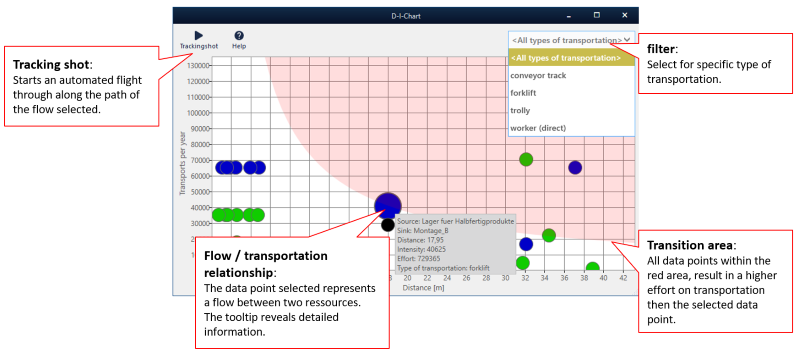
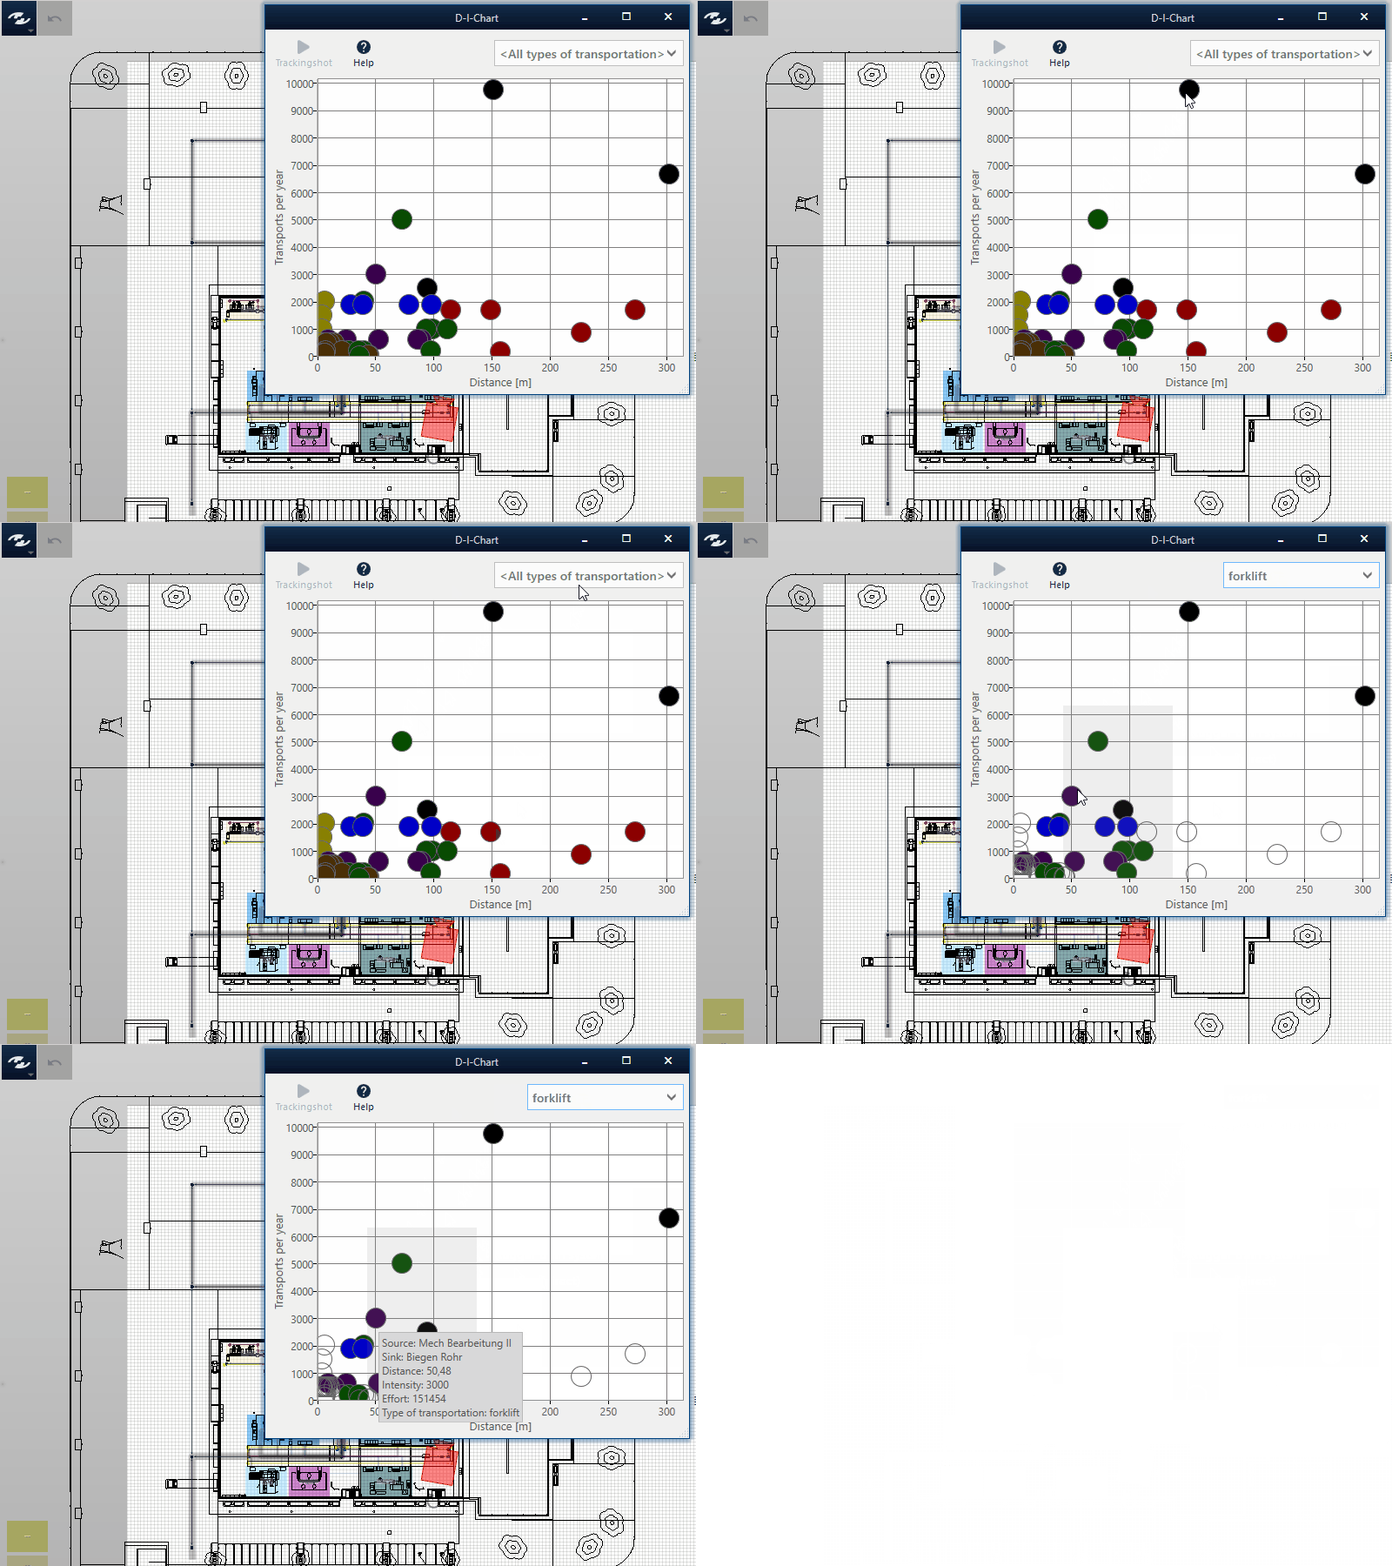
The Distance-Intensity Chart shows an overview of the flows of a layout in the form of points arranged in accordance with the two axes by their intensity (usually, the number of transports) and distance (Flow Length) between source and sink.
Distance
The distance is the length of the route between the material flow nodes of source and sink via the transport network in the plane. If the use of transport routes is disabled or is there no transport network for the appropriate type of transport means, the linear distance of the material flow nodes in the plane is displayed as the distance.
This representation facilitates to identify flows which otherwise would require much efforts. The following general measures help to minimize the efforts:
- Adapt the layout: Objects related to each other over a large distance should be arranged closed to each other, or the transport route should be modified.
- Adapt the principle of transportation: Alternative transport means can be used to reduce the efforts when linking objects related to each other through a high intensity.
The aforementioned measures can also be combined to reduce the efforts for objects in which both aspects (distance and intensity) are decisive for the excessive expenditure.
Note
Flows with a fixed distance between source and sink are not represented in the distance-intensity chart. The sources or sinks of these flows possess their own special attributes of the form plavis.vistable.matflow….
The following tasks can be performed in the distance-intensity chart:
- Setting of Filters for Transport Means to select a certain or all transport means,
- Analysis of the relative expenditure by way of the Efforts Limit,
- Selection of a flow to be highlighted in the Layout Area and to display detailed information,
- Automatic fly-through along the flow in 3D view.
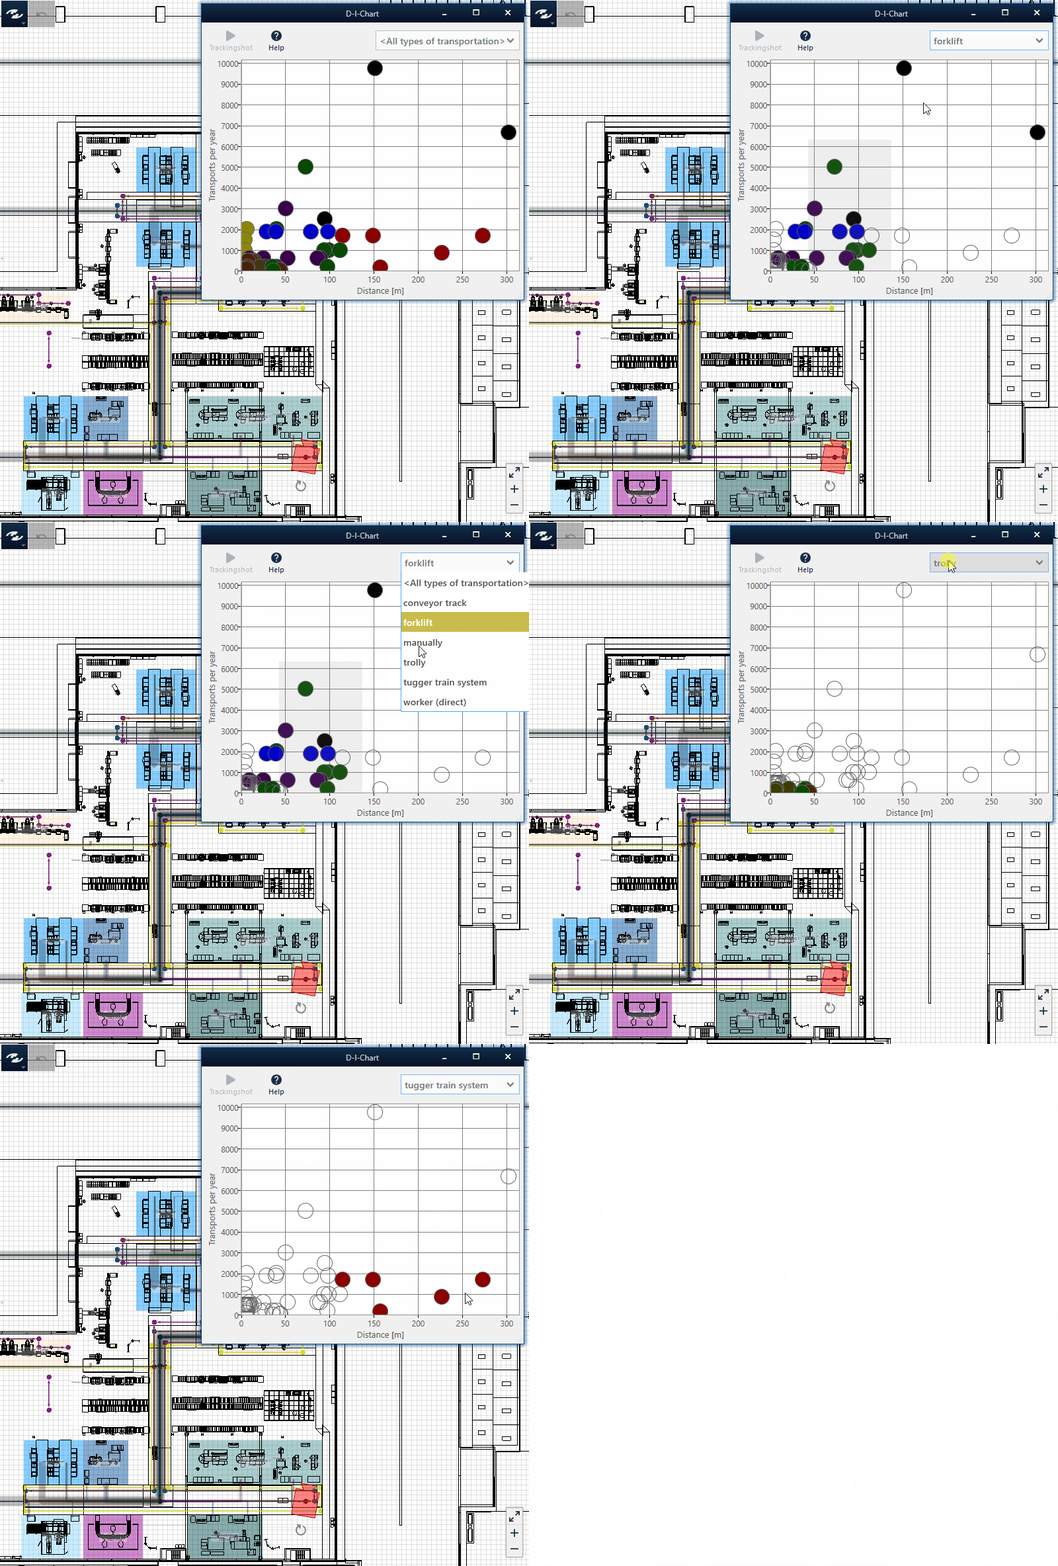
Filters for transport means
- You can select whether to show all flows or only the flows belonging to a certain transport system. Thus, it can easily be determined which transport system covers long distances and/or how many transports are realized by it.
- Depending on the selected transport system, only points belonging to the appropriate transport system are highlighted in color.
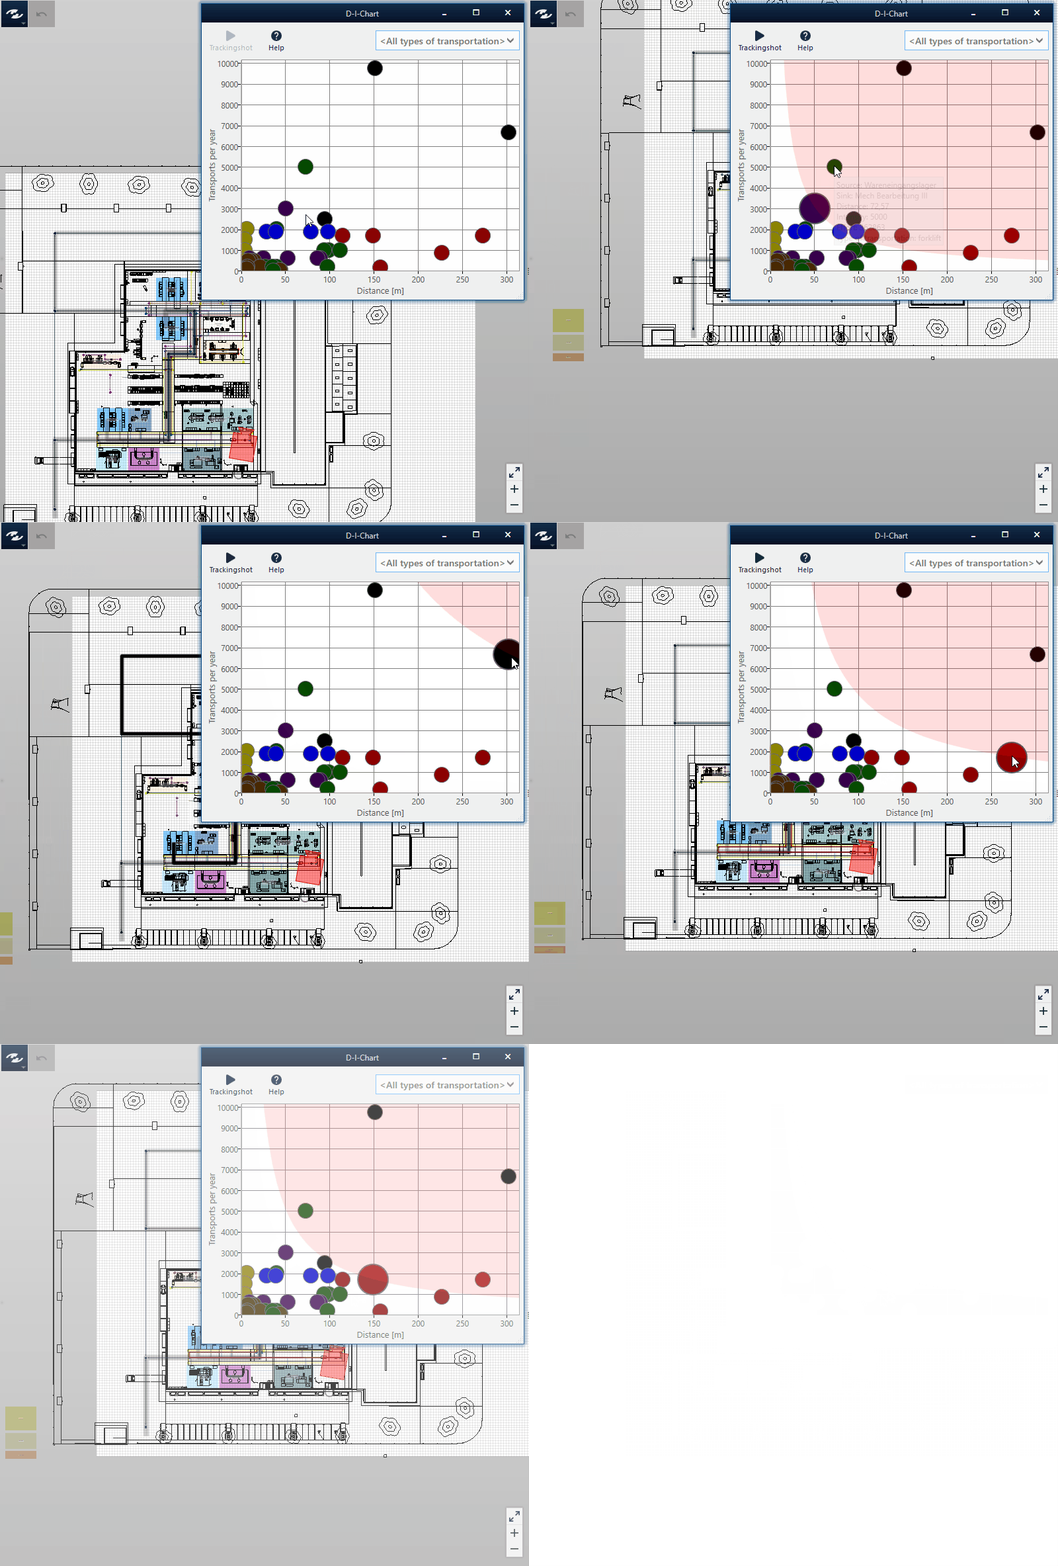
Efforts limit
- When a point is selected in the diagram, an efforts limit is shown in the area highlighted in red. All points lying in this read area cause higher efforts than the selected point.
- This efforts limit helps to compare the efforts in transportation between the individual points to each other.
Selecting a flow
- When moving the cursor over a point, it will display detailed information about the appropriate flow (source, sink, distance, intensity over the number of transports per year, efforts and type of transport means).
- When you select the point, the efforts limit is displayed, and the material flow arrow is centered and highlighted in the 2D layout. For especially large numbers of points, a gray distance area is also displayed. All points outside this area significantly deviate in their distances from the average length of the transport routes realized by this means of transport in the layout.
Fly-through
Once a point has been selected, the fly-through along the flow from the source to the sink can be started in 3D view.
