Lead time analyses
For pass through analyses the Lead time view can be activated when editing a product family. It can be used to determine the Lead time (LT) of a unit of this product family along a selectable Lead time path in the product flow chart.
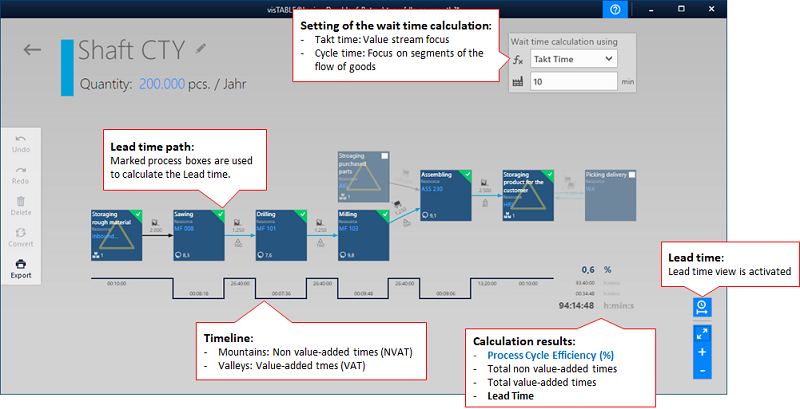
The fundamentals of Lead time calculation in visTABLE® logix
As a general rule, the average Lead time (LT) of a flow unit is to be calculated from WIP (work in process, quantity of the cycle-defining flow units) and the cycle time of the flow system.
For isolated consideration of product flows, it becomes difficult not being able to determine the cycle time of the corresponding flow system from the product flow itself. An exception are product flows leading exclusively to a flow system. If in this special case, in addition, all operations of the product flow are unambiguously assigned to resources of the flow system, the product flow will produce a value stream, and it will be possible to determine the lead time by using the formula for the value stream analysis (VSA) from WIP and (customers) takt time.
In all the other cases, WIP and cycle time for the product flow of influencing factors outside the considered product flow are determined to a greater or lesser extent. Therefore, it is merely possible to calculate minimum lead times for the most product flows, assuming unlimited resource availability. To this end, the LT portions are to be determined in accordance with the operation cycle by resolving the product flow into segments of operation and corresponding WIP which in total yield the minimum lead time of a flow unit through the sequence of operations.
In the Lead Time view, this circumstance is taken into account by way of two calculation methods for the waiting time portions of the lead time:
- Calculation in accordance with the (customers) Takt time (Value stream view): Subject of the appraisal is the complete stock of the Lead time path as WIP in the customer cycle which is currently not processed.
- Calculation in accordance with the Cycle time (Product flow view): The WIP is segmented. The lead time portions of the segments result from the cycle times of the corresponding operations.
Procedure
Select a product family in the Production Program view and activate the Lead time view in the bottom right corner in the Product Family view to be able to produce a pass through analyses for the selected product flow.
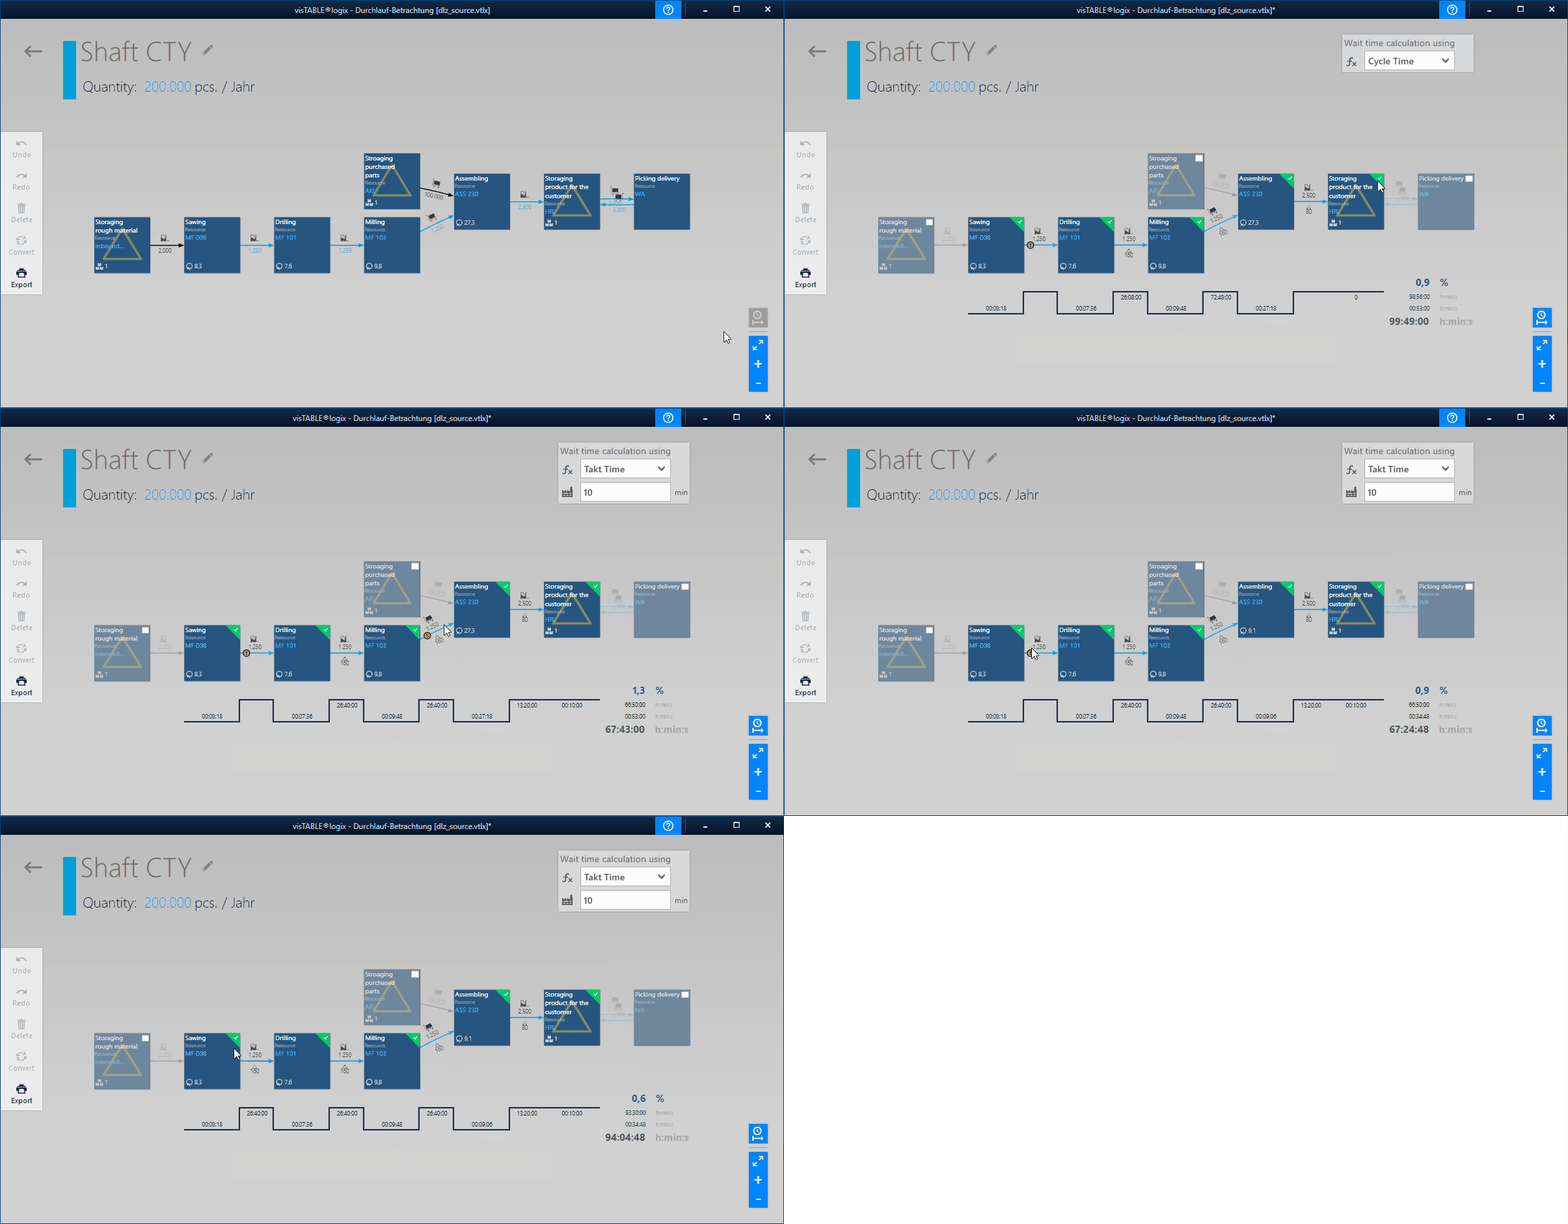
- First specify the Lead time path and thus the part of the product flow chart that you wish to subject to Lead time.
- Now you should specify how the waiting time portions are to be calculated. To this end, select the calculation method at the top and specify the (customers) takt time required for the value stream analysis. You can switch between the calculation methods at any time.
- Now specify or verify the operation times at the process boxes. To this end, select a process box; subsequently, the
process stepeditor is displayed in the top right corner of the window. Your inputs in the left-hand time value field are displayed immediately in the valleys of the lead time graph. These time values are added to the value-added time (VAT) at the end of the lead time graph. - Finally, the work in process is to be acquired. This figure is used by the software to calculate the non-value added time portions (NVAT) and displays them on the peaks of the lead time graph. These time values are added to the value-added time (NVAT) at the end of the lead time graph.
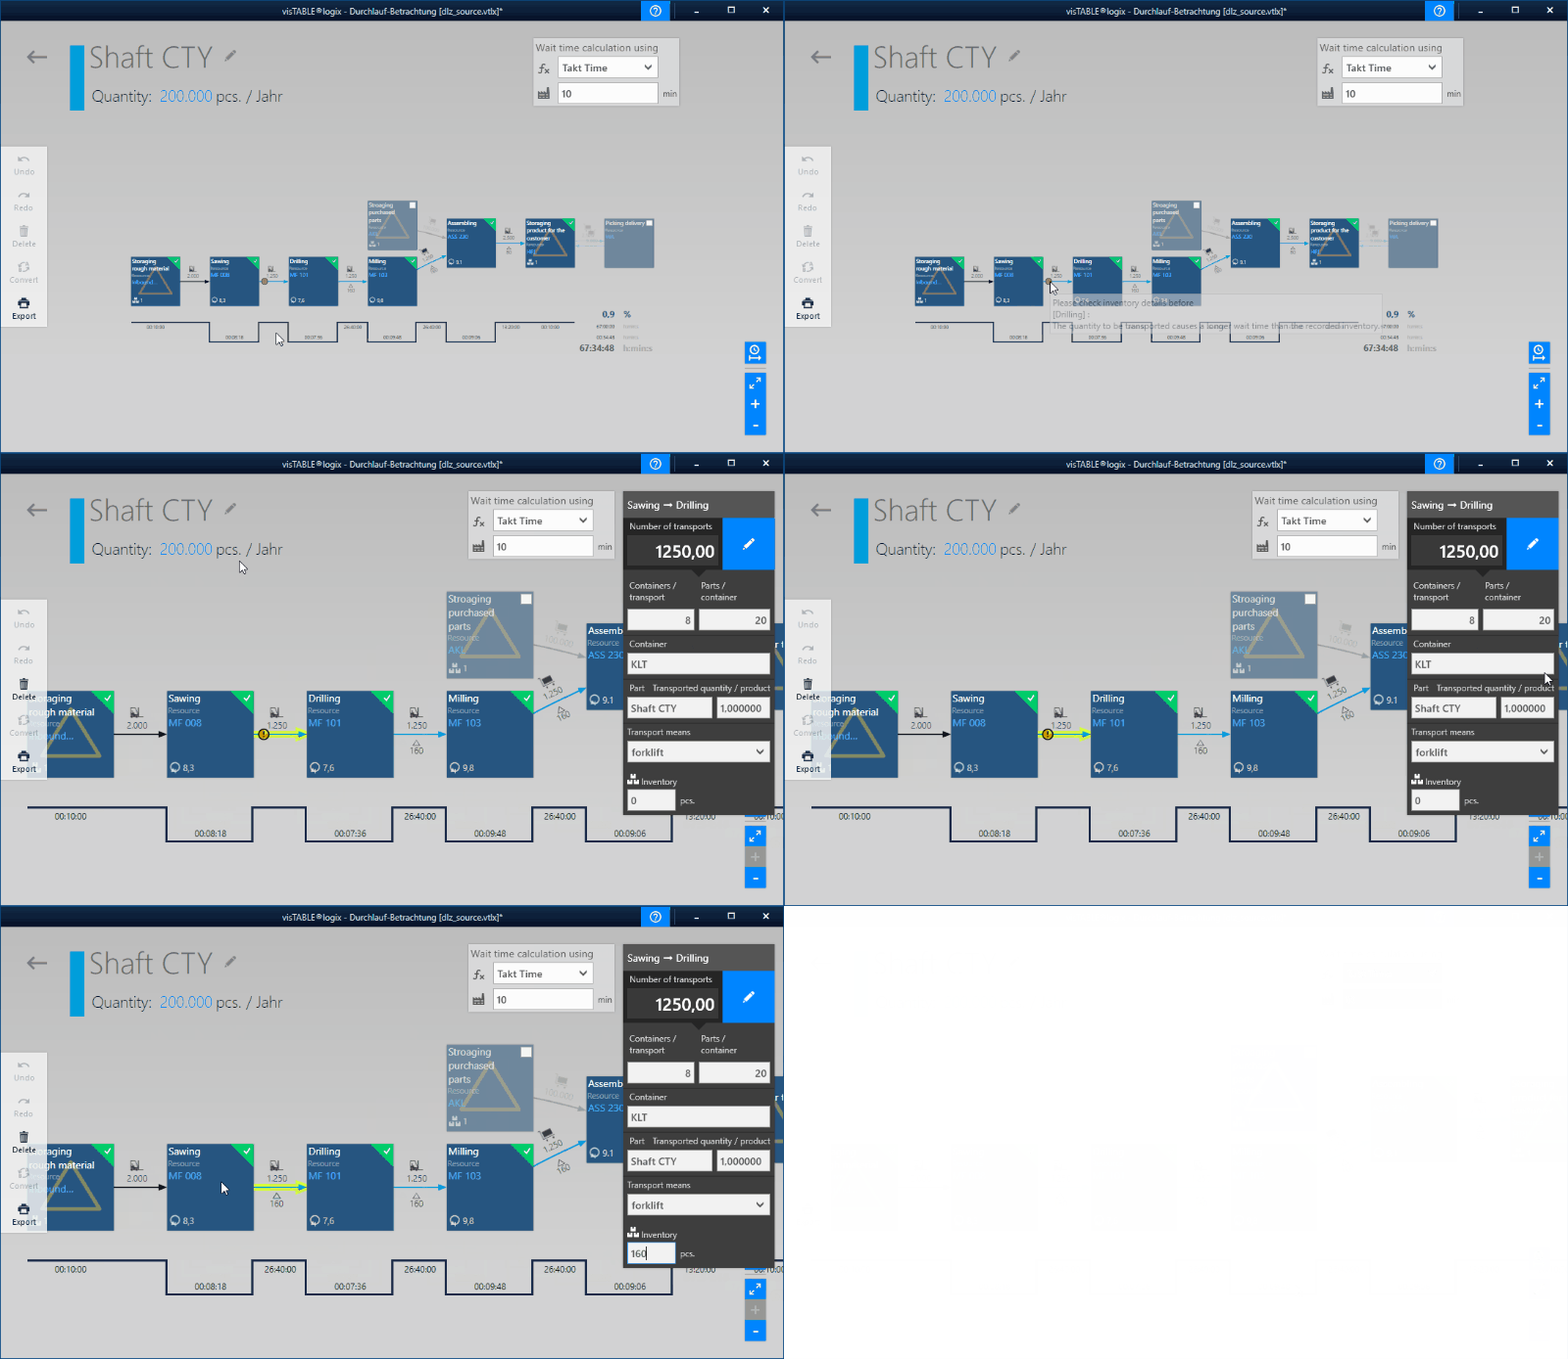
- Check the Lead time path for inconsistencies. This process is assisted by the software by detecting waiting time portions that result from the inputs regarding the quantities transported between two operations and would exceed the waiting time portions of the work in process (WIP) acquired at this point.
Practical tip
To be able to calculate the lead time for a process graph used in visTABLE®logix, it is not necessary to acquire resources, annual quantities or transport data of the product family. If these specifications are missing (or if all transport numbers in the graph are ZERO), no material flows are generated from the graph for the layout. Such product families are also ignored by the logistics evaluation.
Due to this circumstance, graphs can be modeled in visTABLE®logix for the purpose of cycle time calculation only. As a result, complicated material flow relationships can thus be depicted more easily with reference to the lead time in some cases (e.g. by abstraction in value stream charts).
Inputs
The following inputs are taken into account in the Lead time calculations, depending on the method of calculation of the waiting time portions:
- Lead time path,
- (Customers) Takt time,
- Operation times required by value-added operations,
- Work in process (WIP) caused by storage operations,
- Work in process (WIP) caused by transports,
- Transport quantities.
Lead time path
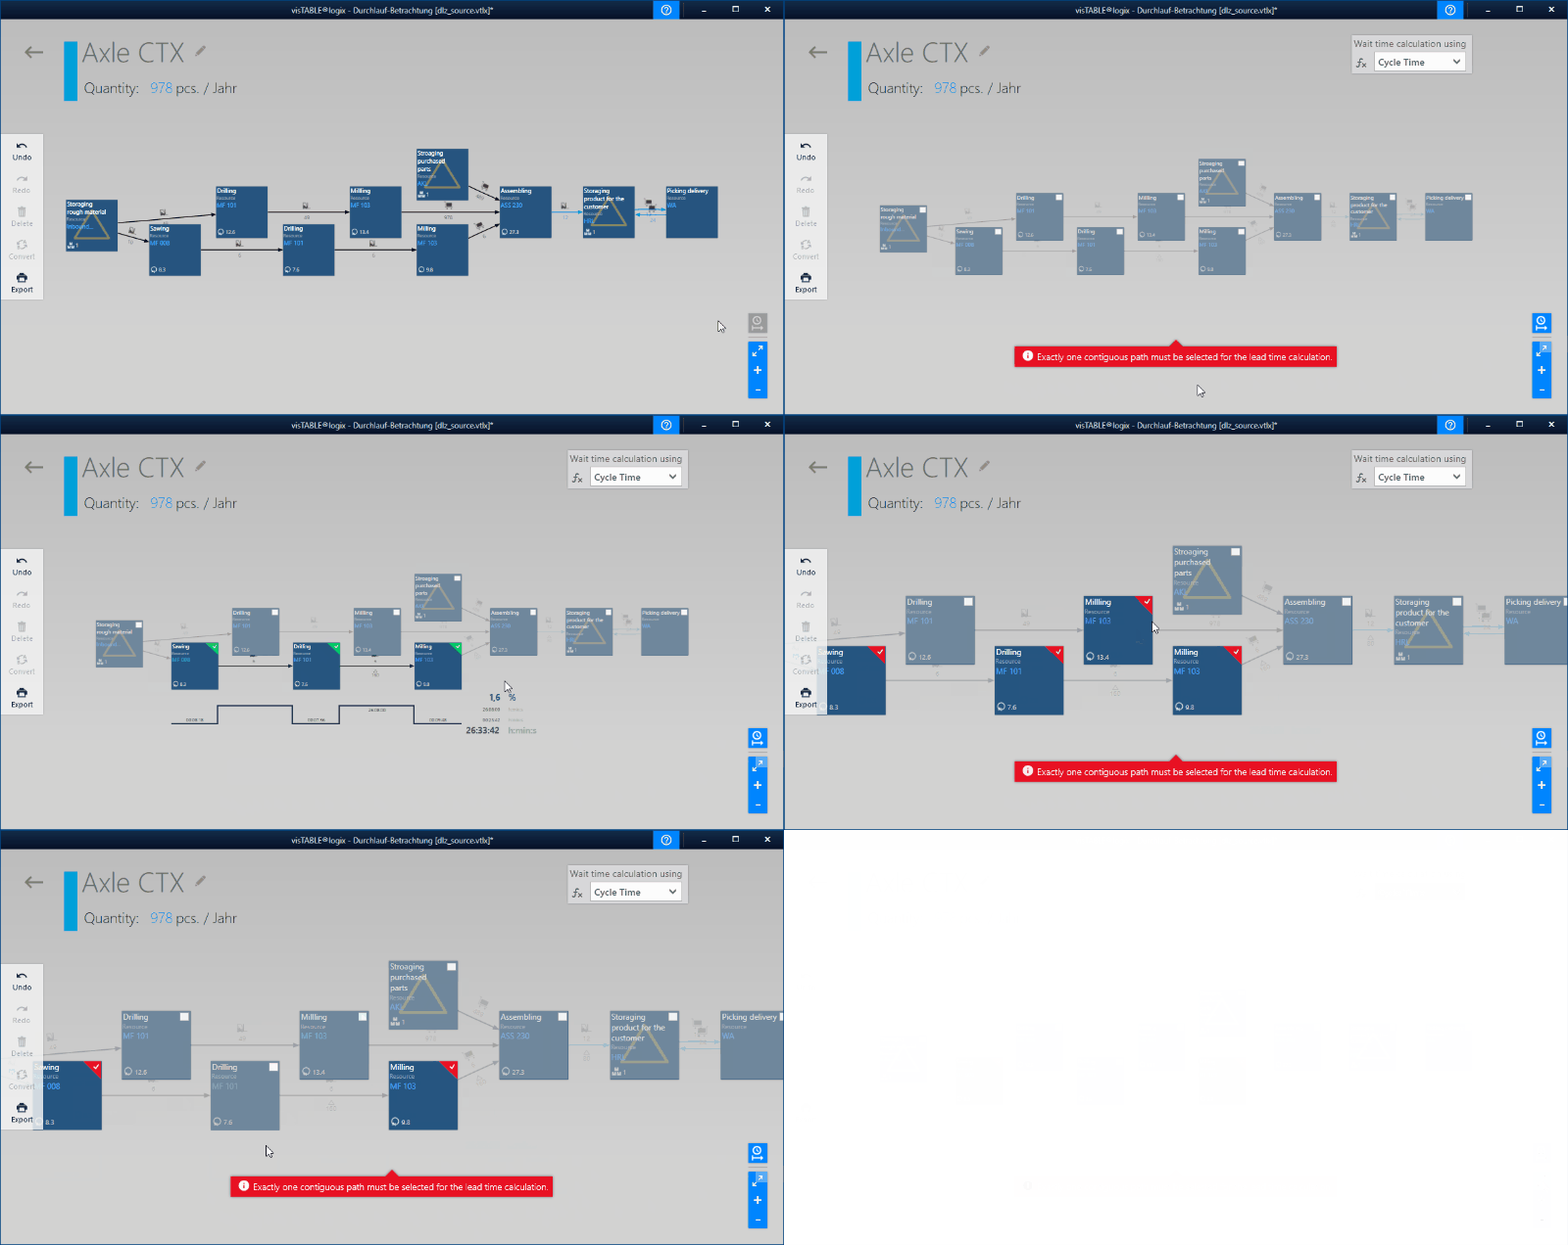
You can select any coherent branch of a product flow graph by activating the checkbox in the top right corner of each process box. If no permissible Lead time path has been selected, a red notice is displayed instead of the cycle time characteristic beneath the lowest graph. In this case, the checkboxes of the selected process boxes are highlighted in red.
(Customers) Takt time
If you wish the lead time for the considered Lead time path to be determined in accordance with the value stream analysis concept, the software will calculate the waiting time portions by multiplying the work in process (WIP) acquired at the Lead time path with the so-called customer cycle. In visTABLE®logix we use Takt time for this input value.
The (customers) takt time is to be specified when selecting the calculation method for the waiting times. The time formats min (minutes) or hh:mm:ss are provided for input.

Where does the customer cycle come from?
Due to the fact that the customer by definition reacts with calls at the end of a Value stream, his call cycle is referred to as “Customer cycle”. In view of its functionality, the customer cycle is consequently a cycle time. It describes the maximum time that may pass between two succeeding exits of a unit of the product family from the Value stream. The customer cycle is required at the last resource of the process chain of a Value stream.
A customer is also deemed a follow-up process within this meaning. If the “real” customer cycle cannot be transferred directly to the considered product flow or is not known, then use the rate of consumption required by the follow-up process, instead of the customer cycle.
Work in process
Work in process (WIP) includes the quantity of flow units which is integrated directly into the value-added chain of the Lead time path and, figuratively speaking, handed over in the flow cycle. If the flow units are not in transformation (e.g. processing or similar increases in value, for example), they will generate non-value added time portions (NVAT, as a rule, waiting times). Only these flow units must be acquired in visTABLE®logix to be able to calculate the lead time as work in process. They are typically to be found as
- Stocks of units or feedstock of the product family (e.g. bar material in the raw materials storage for shaft production),
- Buffer stock of units or feedstock of the product family prior to value-added steps (e.g. shaft blanks at warehouse areas, or finished parts at pick-up areas),
- Quantities of units or feedstock of the product family which are on transport systems (e.g. quantities to be conveyed on a roller conveyor).
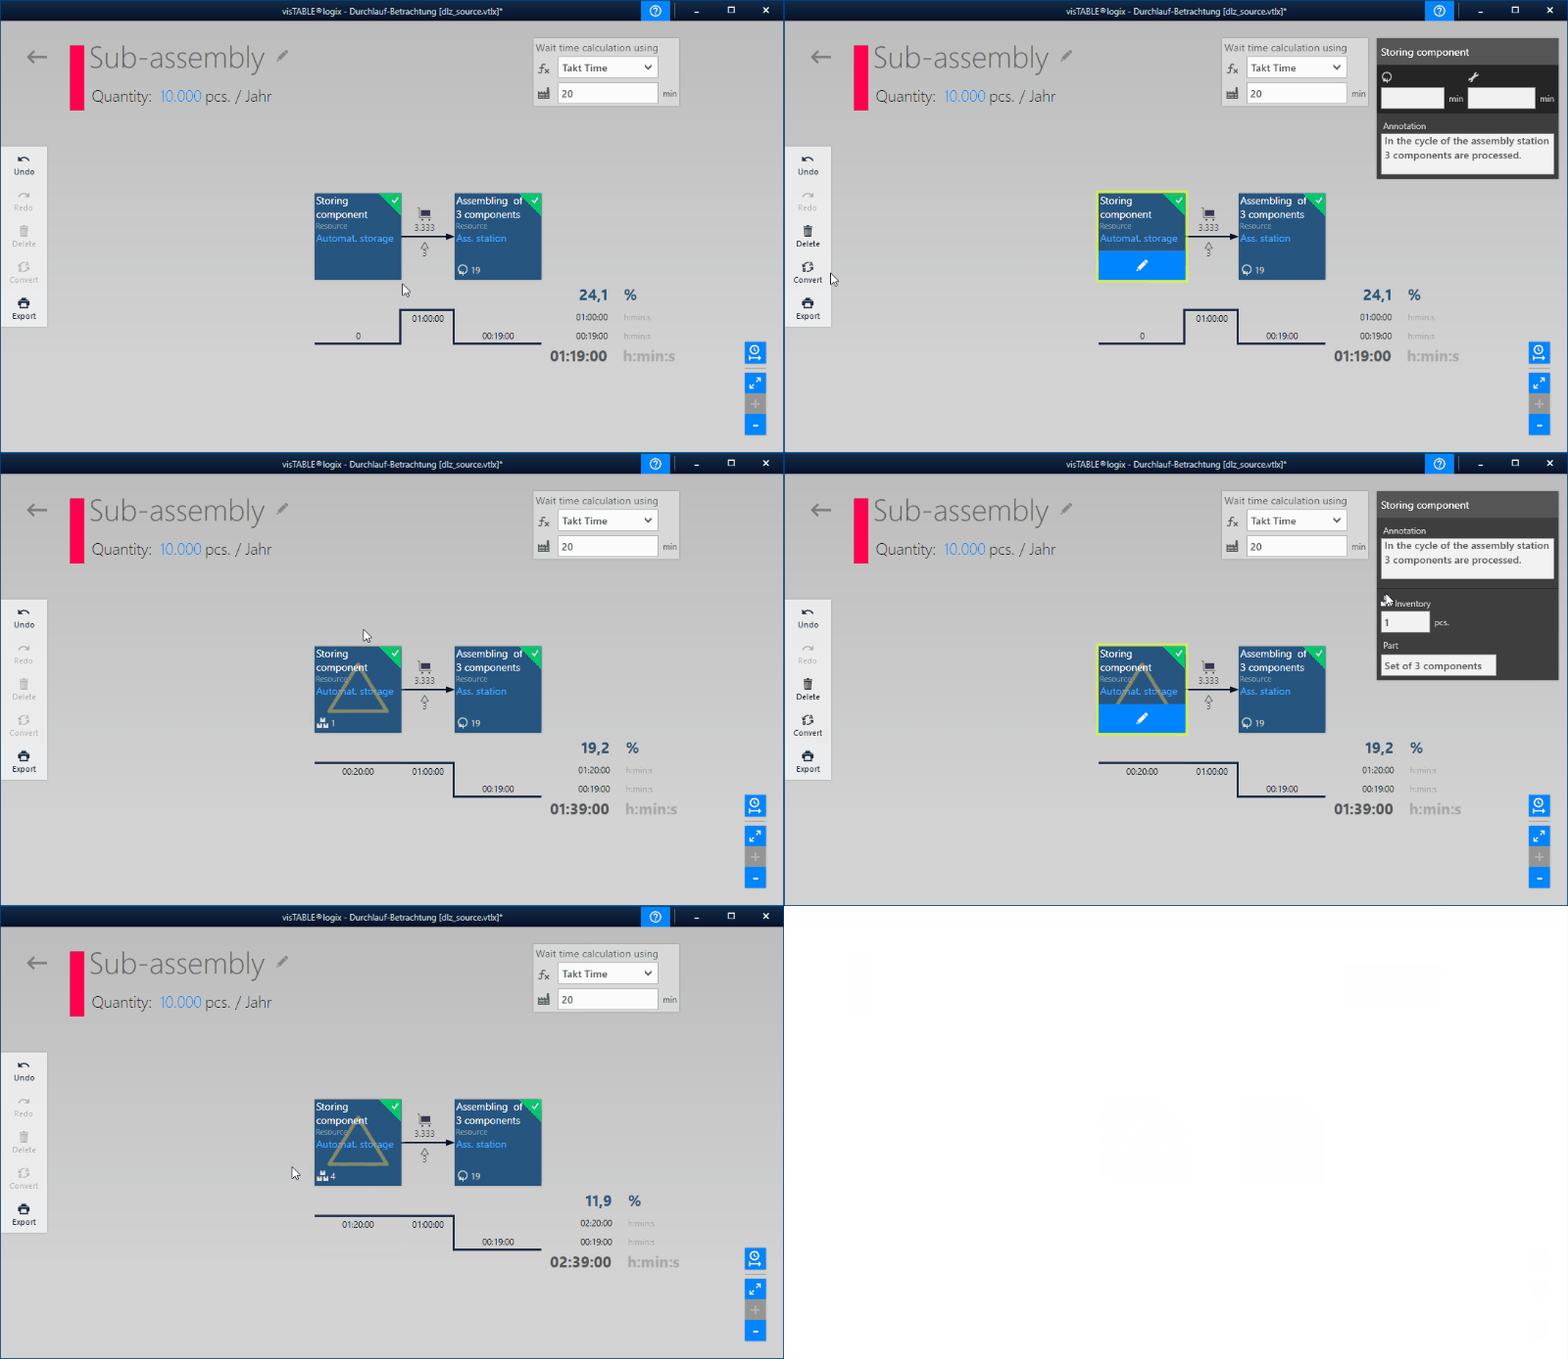
To be able to design the modeling in the product flow chart as simple as possible, work in process can be acquired at special storage operations and directly at the transport arrows. The process boxes occurring in already existing layout documents can be converted into storage operations (see animation) for this purpose by way of the Convert menu action:
Process resolution
To be able to evaluate the transport efforts, a higher process resolution can be required for the logistic processes than as required for a pure value stream analysis. High process resolution is likewise always advantageous for detailed planning. The consequence of these two factors is often that the product flow is distributed over several operations of one and the same resource. In this case, attention should be paid to work in process inside the same resource, as it also influences the waiting time, in conjunction with the (customers) takt time or cycle time.
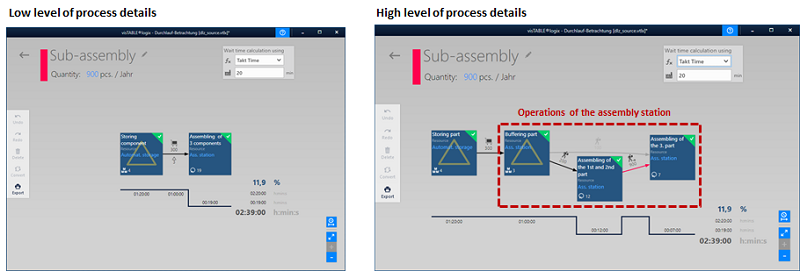
- Example for modeling work in process in accordance with the process resolution:
In our example, the work in process was modeled on the transport to the resourceAss. stationon the left. All activities at the assembly station are taken into account with their cycle time. On the right, the sequence at the resourceAss. stationis shown in detail and distributed over several operations. The work in process was acquired here completely at the storage operationBuffering parts; time portions from the distribution of the components within the resource are taken into account in the operation times of the two assembly operations.
Reference quantities
Please observe that the acquired work in process is to be multiplied either with the operation times of the follow-up operation or with the customer cycle, depending on the calculation methods for the waiting time portions. You should therefore only acquire quantities in FIFO calls as work in process with reference to the consumption for one product family unit.
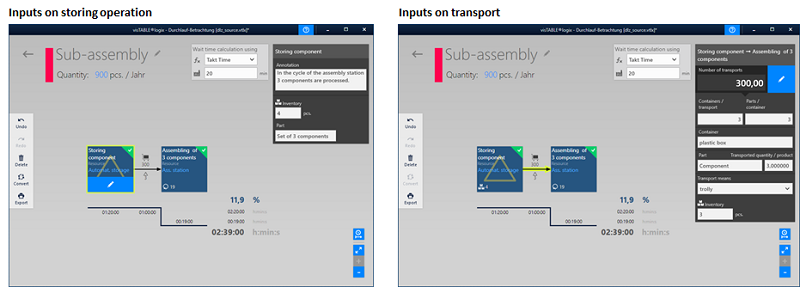
- Example for mapping quantity references:
In a cycle of 19 minutes, three identical components are assembled at the resourcescrewing stationto one product family unit. The stock of components is 21. Acquire a total quantity of 7 as the work in process which is effective for the waiting time for the components at the storage operation and at the transport. Specify in the input fieldPartthat a set of three components is considered. However, it should be taken into account that the number of transports is calculated in accordance with the transport batch size (Containers/transportxParts/container) and the specification underQuantity transported/product. To keep the inputs traceable, you can refer the transport directly to the component in quantity 1.
Operation times
Operation times are acquired in the left-hand time input field of the Process Step editor for process boxes which represent steps of the value-added chain. In the pass through analyses, they lead to value-added time (VAT). The following types of planning time values can be used:
- Cycle time: The cycle time specifies how long the cycle of a unit of the product family takes to pass the resource before the next unit can pass the resource. This is typical for value stream analyses. To this end, the cycle time is acquired directly for the process box that is assigned to the considered resource. Thus, cycle times are always referred to resources, as far as the resource definition within the meaning of layout objects used in visTABLE® is concerned. It always becomes difficult if the cycle time of a resource was modeled with distribution over several process boxes. In this case, the cycle time must be acquired proportionately as the operation time at the process boxes assigned to the resource.
- Takt time: The takt time has the same functions as the cycle time. It represents the output rhythm of cycle-defining flow systems. It should be observed that the target takt times at the aggregation level from times per unit are to be used for the prospective pass through analyses, i.e. the basic time, incl. surcharges.
- Time per unit: The time per unit specifies the expenditure of time within the meaning of binding capacities of people or equipment intended for complete performance of an operation for a unit of the product family under defined general conditions. These general conditions have already been acquired by way of the method for synthesis of the time which is used for determination of the time per unit, e.g. with reference to tools, distribution and recovery time portions, division of work, and performance expectation. Thus, times per unit are not referred to resources, as far as the resource definition used in visTABLE® is concerned, if there are other resources at which the operation is to be performed under general conditions defined by way of the time value.
Practical tip
In many cases in practice, cycle time and time per unit are equivalent. By tendency, you will use times per unit as operation times if product flows with high resolution are present. Such product flows usually contain several operations with the same resources assigned. Complex processes (e.g. containing loops) can thus be mapped as linear graphs. Furthermore, now distributions within product families with many variants can be considered (so-called structural quantities). Cycle times are used in value stream analyses in which each process box represents exactly one resource.
Results
Timeline
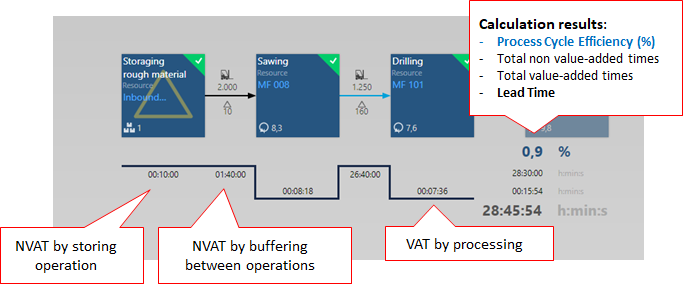
- The software displays the time portions used to calculate the lead time beneath the lowest graph as outputs in the Timeline. Times at the time line are output in the fixed format
hh:mm:ss(hours : minutes : seconds). - At the end of the Timeline (right), the aggregation of the time portions regarding Value-added time (VAT), Non value-added time (NVAT) and Lead time (LT), as well as the Process cycle efficiency (PCE) is displayed.
Visualizations in the product flow graph
In addition to the contents visualized in the Product Family view, the Lead time view of the product flow graph displays
- Specifications regarding work in process with impact on the waiting time, and
- Inconsistencies in the inputs regarding work in process and transport quantities where detected.
- The process boxes of the Lead time path under consideration are highlighted.
Detection of inconsistencies in acquired work in process
The work in process belonging to a product flow segment consists of storage and buffer quantities. This also pertains to the quantities in transport systems (e.g. in the form of transport batches). They are defined via the container content and the number of containers per transport, thus forming the minimum possible work in process between the operations involved in the transport. visTABLE®logix uses a heuristics to calculate the resulting minimum portion of waiting time to be expected. This value will be compared to the waiting time portions resulting from the inputs for the work in process of the product flow segment concerned.
Inconsistencies result if the acquired work in process would produce lower waiting times than those as caused by transport quantities. In these cases, the transports of the product flow segment will be highlighted accordingly. This are usually errors in the acquisition.
If any inconsistencies were detected, always observe the following examination procedure:
- Has the transport quantity been taken into account in the acquired work in process? If not (usually, errors in the acquisition), the acquired work in process must be adapted accordingly.
- Must the transport quantity be reduced (e.g. by reducing the transport batch size) to be able to guarantee work in process acquired as a target value? This results in a reduced lead time, and the number of required transports increases.
