Material flow
The Material Flow task area provides an overview of the functions and settings integrated into visTABLE® which can be used to define, evaluate and represent flow data.
Generally speaking, flow data describe the causes for material flows in the factory. In visTABLE®, they are defined as Product Flows or by way of transport tables or matrices. The possibility of importing and exporting the data from or to Microsoft® Excel® facilitate the preparation from and for data sources and sinks which are available otherwise and are used for the dimensioning or operation of the factory (e.g. simulation, ERP or labor-planning calculation systems). All types of (countable) piece goods transports can be used as a source for flow data in visTABLE®; continuous flows of material require modeling as a Mass or Volume Flow (e.g. for the so-called process industry).
User interface
The settings for the Material Flow are called from the System Menu and displayed in the Task and Tool Area.
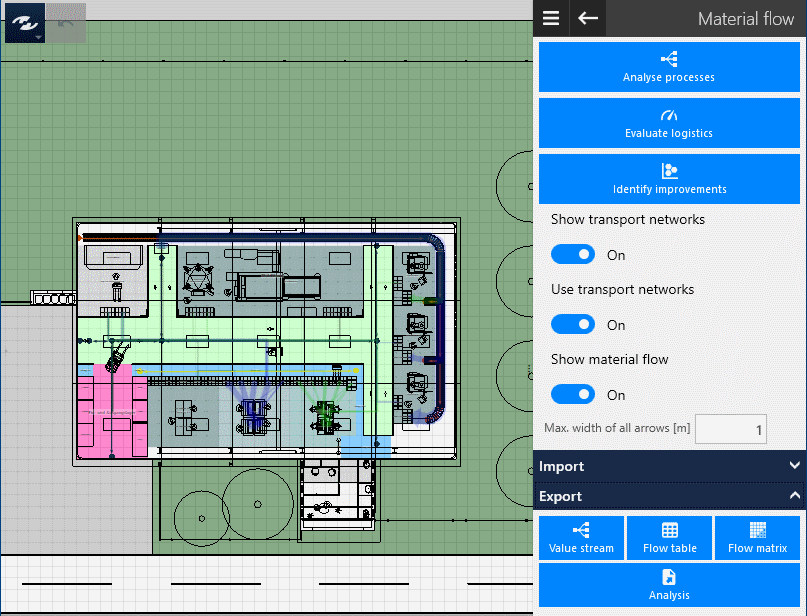
Task area with existing flow datasets
Settings of the same function group are summarized in sections (sometimes, in expanders):
- Material Flow Tasks;
- Material Flow Settings;
- Import & Export of material flow data.
Task area without flow datasets
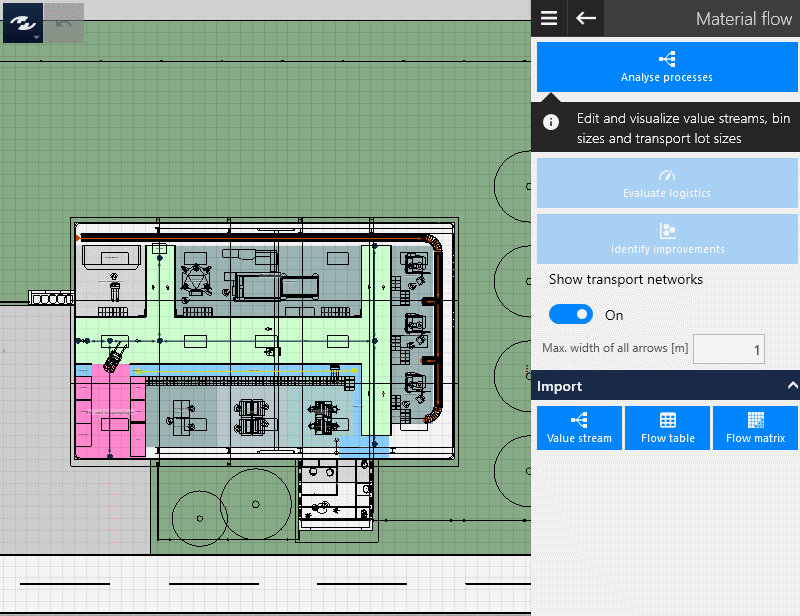
- Some functions are only available if flow data exist in the layout.
- In this case, start first with an analysis of your processes or import the relevant information.
Material flow tasks
The section provides access to design and evaluation functions for flows in visTABLE® in a compact form:
Analyze Processesis the first and essential task to design layout in accordance with the material flow. To start visTABLE®logix, left-click or tap on the button.- The
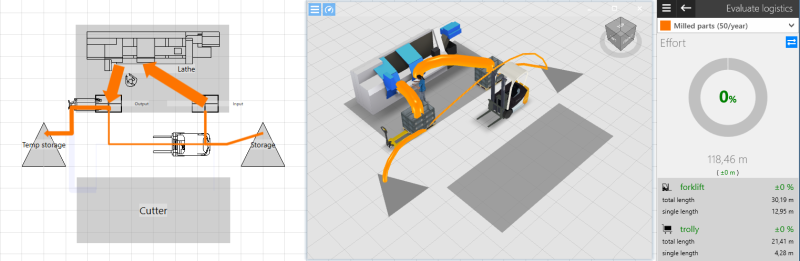
Logistics Assessmentfunction can be used to analyze the efforts and costs for transportation by way of the Logistics Assessment Function of visTABLE®touch. Find Approaches for Optimizationstarts the analysis of the flow relationships by way of the Distance-Intensity Chart.
Material flow settings
This menu item comprises settings for Flow Visualization and for the use of Transport Networks:
Show Transport Networkscontrols whether or not the defined transport networks are to be visible in the layout area. Hiding transport networks increases the clarity in the 2D representation. This has no influence on the routing of the material flow. It is normally only necessary to display transport networks to design or modify them. Transport networks are not visible in the 3D ViewUse Transport Networksspecifies that all transports are to be carried on the shortest route through the transport networks where possible. If individual flows cannot reach their transport network, the cause is to be seen in the modeling of the transport network itself, not in this setting.Show Flowsactivates or deactivates the Flow Visualization (flow arrows in 2D).
- Opening the Distance-Intensity Chart also opens the flow display automatically.
- When the Logistics Assessment is active, this setting is ignored.
- Opening the Distance-Intensity Chart also opens the flow display automatically.
Max. Arrow Widthspecifies the width of the arrow which corresponds to the flow with the highest intensity. This is connected to the width of the Network Load Display, the width of the Network Edges and the size of the Network Nodes. The higher the value for the maximum arrow width, the thicker are the transport networks represented in the layout.
Hiding/showing material flows and transport networks
Flows and transport networks are normally visible in the layout. Certain assessment functions are displayed in the layout automatically when called. Nevertheless, you may wish to show the flows explicitly, or you wish to hide the flows or transport networks explicitly for better clarity.
In addition to the possibility of influencing the visibility by way of the Layer Control, the procedure when using the central task area ‘material flow’ is described in the following.
Prerequisites
To be able to represent flows, it is imperative for flows to have actually resulted from the underlying data. It is therefore recommended to familiarize first with these basics.
Procedure
- In the System Menu, call the
Material Flowtask area. - To hide or show flows or transport networks, use the
Show FlowsandShow Transport Networksswitches.
Using or ignoring transport networks as restrictions
visTABLE®touch usually uses transport networks as restrictions for automatic calculation of the routes for flows. In this way, it is possible to take into account restrictions that become relevant in real layouts in later planning phases. If you wish, however, to get a rough overview or temporarily ignore the already stored restrictions, you can temporarily disable the use of transport routes for the whole layout.
Procedure
- In the System Menu, call the
Material Flowtask area. - Use the
Use Transport Routesswitch to enable or disable the restrictions. The calculation is based on your settings. The flows are visualized correspondingly, and your decision is taken into account by the evaluation functions (e.g. the Logistics Assessment).
Import
- Allows you to import material flow data in the following formats: Value stream (visTABLE®logix), flow table, flow matrix or visTABLE® layout (VTLX file).
- The value stream (visTABLE®logix), flow table and flow matrix formats must be available in Microsoft® Excel as a workbook (.xlsx).
- When importing Microsoft® Excel formats, you have the option to either completely overwrite the existing material flow data or to supplement the existing data with the data in the file. Aggregation may occur in this process. When importing a VTLX file, all data is overwritten.
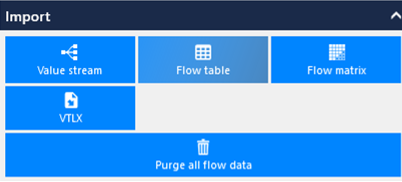
Practical tip
To produce templates for the data import, export the desired format from a layout that already contains the appropriate flow relationship. The structure of the Excel workbooks is usually derived from these data.
CSV Import
; is used as data separator and the Windows configuration (, or .) is used as decimal separator.
Value stream
The product flow format is the most detailed form of representation for flow relationships. Hence, a flow can be broken down into the involved product families and dissolved into the individual transports between the process steps. In addition to the sources and sinks, it is also described explicitly for each transport which operations (process steps) are performed at the sources or sinks, which parts and transport containers are moved and which types of transport means are involved. When importing material flow data in the product flow format, you can map several product families in an annual production program and process in visTABLE®logix.
Flow table
The transport table format aggregates the flow data insofar as each flow is described merely as a relationship between a source and a sink with a certain intensity and the use of a type of transport means. The numbers of the transports [transports/a], volume or mass flows [m³/a or kg/a] are accepted as the intensity measure. The efforts in transportation are output in visTABLE®touch either in m/a or a mass or volume flow length related to the corresponding year. This format is especially suited for planning on the plant structure level in the concept and rough planning phase. Furthermore, the transport table format can easily be filled with transport jobs from an ERP report.
Intensity measure
To be able to differentiate between the individual intensity measures, specify the desired unit in the table head of the 3rd column of the import table as follows:
- Do not use square brackets in the “Number of transports” field, i.e.: Intensity
- for mass flow: Intensity [kg],
- for volume flow: Intensity [m3] (the numeral ‘3’ is not raised)
Resource count
If more than 100 resources (flow objects) are subjected to the heuristic layout optimization , this is very difficult to handle with the participative methodology implemented in visTABLE®. These methods reach their practical application limit with this number of resources. For this reason visTABLE® warns when importing flow tables if the limit of 100 resources is reached by the imported data set. Work around this by hierarchical modeling for the flow systems.
Fkow matrix
The transport matrix format rounds off the possible import formats by the matrix format which is especially widespread in academic studies. Only the sources and sinks, as well as the intensity are processed in the Number of Transports measure. The direction of the flow relationship between layout objects, i.e. finally their function as a source and/or sink, is defined via the position of the intensity value relative to the main diagonal of the matrix:
- The reading direction of the matrix is from the 1st column to the 1st line, i.e. the sources are in the 1st column, and the sinks in the 1st line of the matrix.
- Transports above the main diagonals run in the opposite direction to the transports beneath the main diagonals.
VTLX (visTable® Layout File)
The VTLX format allows material flows to be transferred from one visTable® file to another. This is particularly useful when developing multiple layout variants that should use the same material flows across different planning scenarios. Unlike the import formats described above, the VTLX import also transfers Value Stream Analysis data. This includes process times, setup times, and inventory data. As a result, material flows, including their value stream-related properties, can be transferred between different layout variants.
Overwriting Existing logix Data
When importing a VTLX file, all logix data in the target file is replaced by the logix data from the source file. Any existing logix information in the target file will be lost.
Export
Here you can save flow data in Microsoft®Excel workbooks (.xlsx). You can use this information to supply your own workflows.
Value stream, Flow table, Flow matrix
Enables the export of material flow data in the formats mentioned during import:
- Value stream: All transports of all product families are exported as soon as at least one product family is defined.
- Flow table: The export is only available if at least one flow is defined in the layout. In addition, the distance covered by the flow and, if applicable, the causal product families are output in the export. The number of curves and crossings affecting the flow is also exported.
- Flow matrix: This export is only available if at least one flow is defined in the layout.
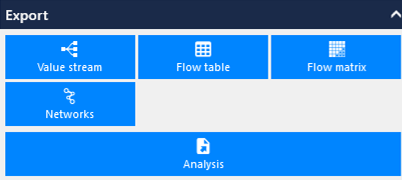
Networks
Exports the transport networks to an Excel file for further use in other applications. The 1st worksheet contains all nodes, the second all connections.
Analysis
This allows you to export the information that is interactively prepared in the logistics evaluation to an Excel workbook. There you will find the information for each product family, broken down for each means of transport.
Flow visualization
To dissolve the complexity, visTABLE® provides two graphical views at the material flow correlations - a process view (product flows) and a resource view (layout).
- Operations and transports are visualized in the process view (visTABLE®logix) as charts representing an operation-transport chain per Product Family.
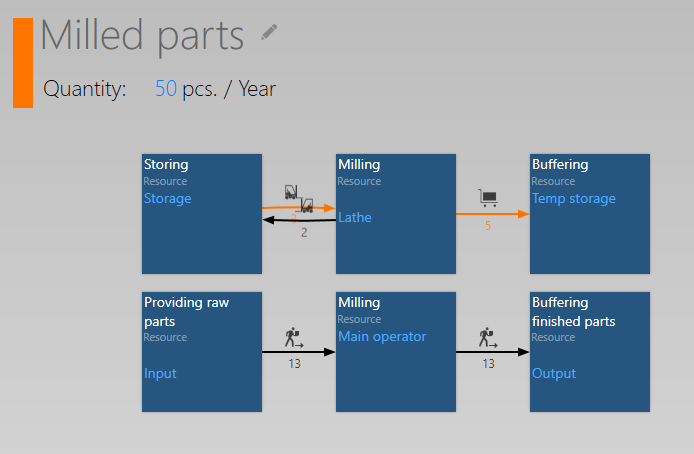
- Flows are represented spatially in the resource view (layout):
- In 2D, a route (defined by an ordered set of supporting points and the resulting flow length) results for a flow between the material flow nodes of Source and Sink, which is represented to scale by way of a colored arrow.
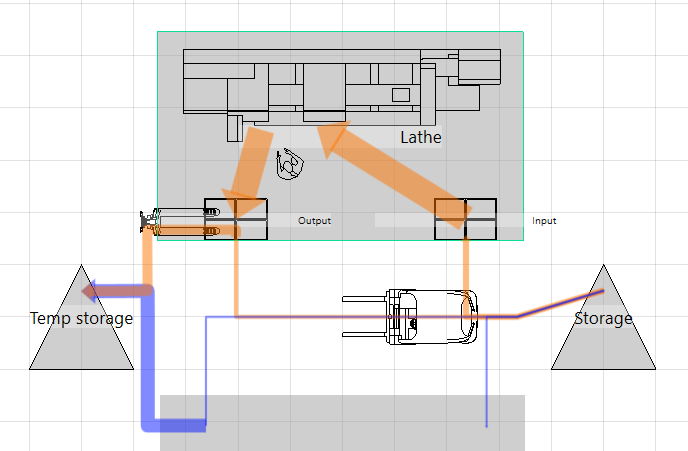
- In 3D, a flow is represented as a bomb trajectory between the material flow nodes of source and sink.
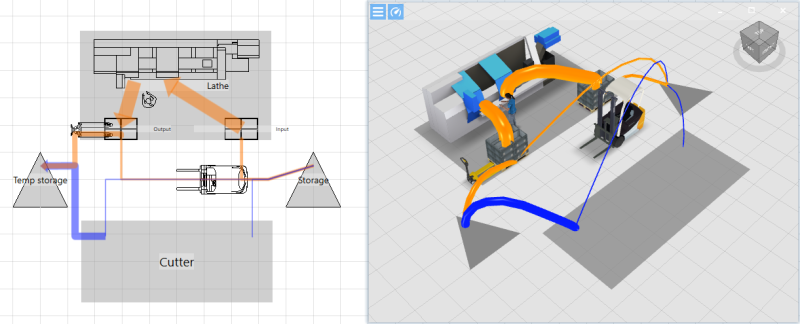
- In 2D, a route (defined by an ordered set of supporting points and the resulting flow length) results for a flow between the material flow nodes of Source and Sink, which is represented to scale by way of a colored arrow.
Tipp
The 3D material flows are visible when Logistics evaluation or Layout optimization are active.
- The material flow nodes can be found in the middle of the bounding box of the flow object and can be moved.
- Flows can be viewed filtered by Product Families. The resulting visualization reflects the product flow of the product family in the layout.
- In 2D, the intensity relationships between the flows are
- represented with reference to the maximum value of all intensities as a percentage-based arrow width (width of the flow arrow in the layout area);
- In 3D, they are represented with reference to the maximum value of the currently (filtered) intensities under study as a percentage-based parabola thickness (diameter of the parabola).
- represented with reference to the maximum value of all intensities as a percentage-based arrow width (width of the flow arrow in the layout area);
- The arrow thickness and resulting parabola thickness which are to represent the corresponding maximum value of the intensities under study in the layout (2D and 3D) can be specified by the user (default:
1 min 2D, also corresponds to1 min 3D). - The colors of the arrows and parabolas result from the color of the product family if only transports of a product family currently under study is represented by the arrow. Otherwise, the arrows and parabolas are highlighted in black.
- The arrows in the visTABLE®touch layout area are transparent to ensure that overlapping flows remain visible.
- The flows in the visTABLE® 3D View are visualized as a direct bomb trajectory starting out from the spatial center point of the source (at an angle of 45°) or from the point at half source height above the material flow node; this similarly applies to the sink for the entering parabola branch. The height of the vertex of the parabola is relative to the corresponding transport length in 2D (arrows with the double transport length as twice as long result in the double height of the parabola vertex).
- If a filter is applied which involves flows (e.g. by way of the Logistics Assessment or the DI Chart), the corresponding arrows are not shown transparently, but in full color. The visTABLE® 3D View only displays parabolas that meet the filter criteria.