Basics of visTABLE®logix
visTABLE®logix serves the logic description of also complex process structures and the related transport logistics in production and assembly. Thanks to the splitting into individual product flows (process chains for Product Families) which are linked via resources (e.g. equipment, warehouse), the process and system complexity remains manageable. The data acquisition tool developed on the methodical basis of the value stream mapping provides the input data for designing slim Production Layouts in visTABLE®touch which correspond to the appropriate material flow.
visTABLE®logix also helps in the planning of material flows in accordance with VDI 2689 “Manual of material flow investigations (“Leitfaden für Materialflussuntersuchungen”). In combination with visTABLE®touch, it provides targeted support especially in the following subtasks:
- Acquisition of the actual state (surveys on the site);
- Evaluation of the actual state (generation of layout-specific Material Flow KPIs).
Practical tip
Check and sort the available data of the area under study (operating schedules, BOMs, in-process documents), e.g. from the ERP system. Identify possible contact persons on the spot (headmen, foremen, transport workers, etc.).
visTABLE®logix supports you in the factory planning process in the planning steps Preparation of the production program and determination of functions (cf. Section Methodical Concept).
Functions and tasks of visTABLE®logix
The general function of visTABLE®logix is that of a process editor; the Product Flow Analysis is used for analyses. visTABLE®logix can be used to perform the following tasks:
- Specification of the Production Program and the planning period;
- Specification of Product Families and Specification or Modifying of your output quantities (usually, the annual quantities);
- Acquisition and work and transport operations for Product Families as value streams or product flows as graphics (process diagram) for analysis on the spot or within the framework of the process design;
- Lead Time evaluation for Product Families;
- Specification of Types of Transport Means and their cost rates for normalized evaluation of Efforts in Transportation;
- Analysis and consolidation of the designations of container and part types which were acquired in the product flow analysis (task 3);
- Export of product flows to Microsoft® Excel;
- Import of product flows from Microsoft® Excel.
Product flow analysis
With the product flow analysis, visTABLE® provides an efficient method for acquisition and documentation of information from value streams which are relevant for the planning of the structure of production systems.
Value stream mapping vs. product flow analysis
The methodology of the product flow analysis is similar to the approach in value stream mapping. In total, however, less data are collected since information flow and capacity, time and inventory data are less important for determination of an appropriate structure of production systems, and instead more significant for their dimensioning
(cf. Section Methodical Concept).
First, delimit the area under study in the layout (cf. Layout Area), i.e. a manufacturing island, manufacturing area or the complete factory. The Hierarchy Level of the area under study results in the necessity to break down the product flow. For example, you will analyze specific part families or classes of manufacturing jobs in their flow between individual locations, set-up, processing or rework stations whereas complete product flows (from loading platform to loading platform) in their flow through the individual manufacturing sections on the factory level are rather acquired in a block layout.
Area(s) under study
The optimization of the layout is in the focus of visTABLE®. Hence, the area under study for the product flow analysis is determined by the Layout Area to be planned. Always acquire all product flows per layout area and form hierarchies of layout areas for complexity management where necessary. This makes identification and delimiting of the relevant Flow Systems easier and facilitates use of the Layout Optimization in a purpose-oriented manner.
Usually, you will find several blanks, finished parts, semi-finished products, packaging materials, etc. per layout area which flow through it, arise therein or are processed in it. All this above must be summarized conveniently to be able to reduce the analysis expenditure and focus on the essentials. The general principle here is that process similarities should be used to identify Product Families. The annual output quantity is determined for each product family or specified for variant planning. The same data frames are used here as in determination of the customer demand cycle in value stream mapping (e.g. sales turnover forecasts or targets). Thus, the analysis frame is fixed which is called production program:
- Area to be examined (Layout Area); should be mapped in a Layout Document.
- Planning period (1 year e.g. 2019);
- Number, type and output quantities of the Product Families
Now acquire the structure of the product flow per product family in one or several diagrams e.g. on a tablet PC by way of Gesture Control.
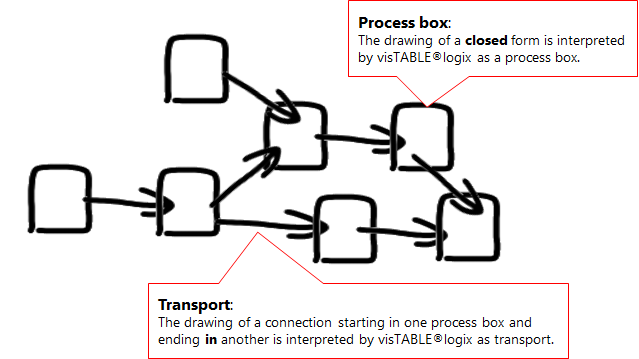
Operations that are assigned exactly to one resource are represented by way of Process Boxes. They map the following data:
- Name of the operation (e.g. slot milling);
- Operation type (e.g. stock operation);
- Name of the resource on which the operation is performed for the appropriate product flow (e.g. DMU 35);
- Notes regarding the operation (e.g. 5 workpieces in one clamping);
- Information regarding the time (processing times and set-up times), if applicable;
- if applicable, circulating inventory (quantity and name of the stored part type).
Transport Arrows are used to represent the transport operations and to symbolize the directed necessary transport operations between the work operations. They are characterized by the following data:
- The Transport Intensity describes how often transport is required to manage the output quantity for the product family in the planning period. The transport intensity can either be calculated by way of a transport inspector in visTABLE®logix or entered directly.
- The Type of Transport Means is directly related to the transport intensity. Its capacity determines the required number of transports.
- The same applies to the Container Type and its degree of filling which can be acquired optionally.
- To identify subsidiary streams in the diagram, the part types characterizing the subsidiary streams can be acquired optionally.
Value Stream Analysis
The value stream analysis opens a compact abstracting perspective on the flow of goods of a production system. visTABLE®logix enables such a value stream perspective after flow of goods have been modeled according to the rules of value stream analysis (VSA) or design (VSD).
Value Stream Modeling in visTABLE®logix
The following modeling rules help to make the best possible use of the functional scope of visTABLE®logix for value stream analysis:
- Structure of linear, in particular feedback-free flows of goods (avoid loops, branches - especially those with structural quantities);
- Exclusive assignment of operations to resources;
- Consider consumption and resource cyclicality (i.e., capture customer cycle and cycle times);
- Consider and capture all work-in-process (WIP) at transformation and storage operations (i.e., for processing, storage, and buffering, respectively) and additionally at transports.
Then visTABLE®logix can be used to determine the following typical value stream key figures on the Timeline:
- Value-added time (VAT): This is the proportion of time during which value is added to a unit of the product family during its passage.
- Non-value added time (NVAT): This is the aggregate of the time not required to add value to a unit of a product family as it passes through a production system. They are usually determined by circulating stocks in warehouses, buffers or transports, whereby stock-proportional idle time shares arise.
- Lead time of a unit from ramp to ramp: The value corresponds to the sum of value-added time and non-value-added time.
- Process Cycle Efficiency: This key figure reflects the percentage share of value-added time in the time required for a run. It is calculated by dividing the value-added time by the flow time multiplied by 100 %.