Layout optimization
The visTABLE® planning function Layout Optimization supports the targeted improvement of the material flow through systematic structuring of production and/or warehouse areas. With the objective to reduce the efforts in transportation, the function identifies first objects or areas in the layout which are involved in the material flow. The function determines and illustrates the
- type of the structure of each flow system,
- the layout optimization technique suited best for the appropriate structure type and
- the resulting layout priority of the objects or areas (so-called resources) in accordance with the connection structure and flow intensities between these layout objects
The visualization is designed for participatory modes of working. It enables ideas for improvement to be formulated and ripen. Such ideas can be transferred into plans and evaluated immediately through systematically guided positioning of the appropriate objects or areas in the layout:

Tip
When the function is active, the color of all Layout Objects not covered by this function is removed.
User interface
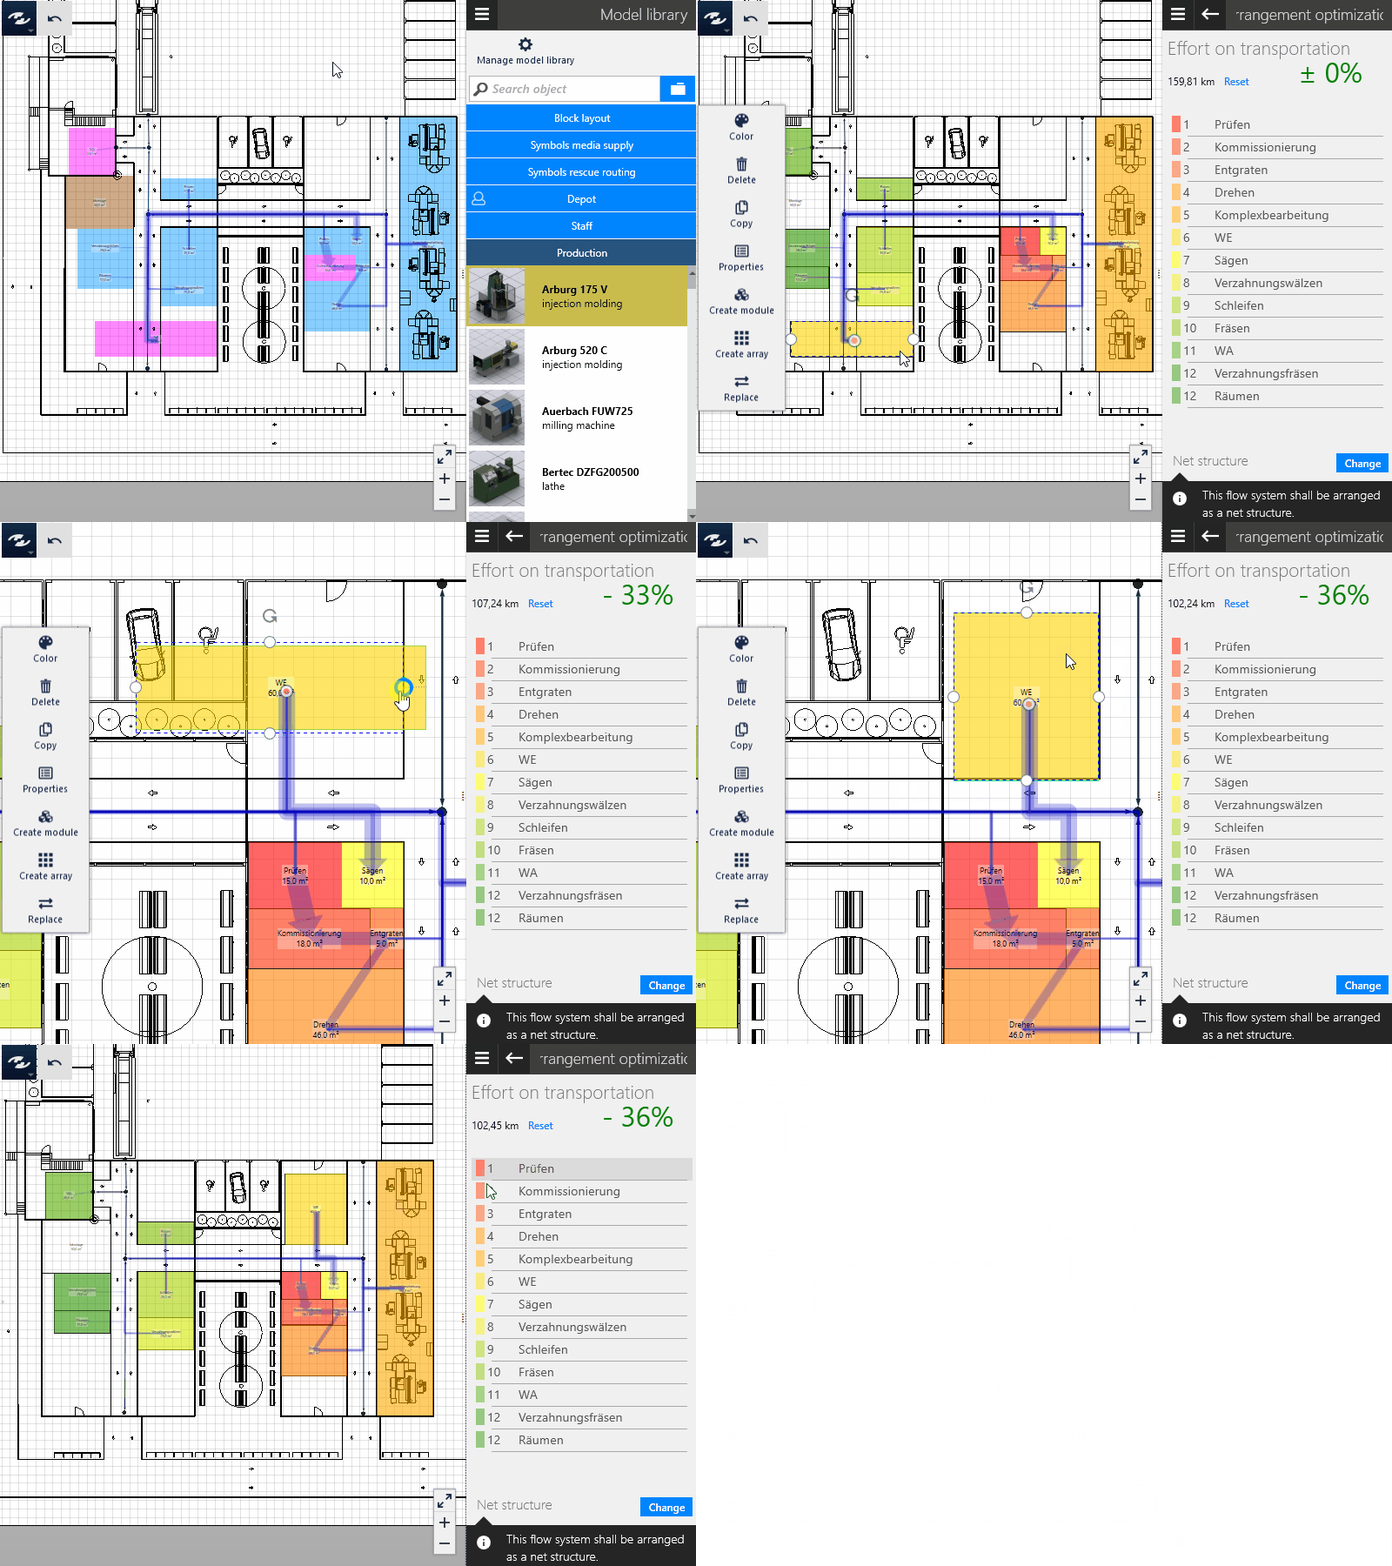
The Layout Optimization is controlled in the Task and Tool Area where the results are also represented. In addition, the layout priority of the appropriate layout objects is indicated in the layout by way of color coding.

Efforts indicator
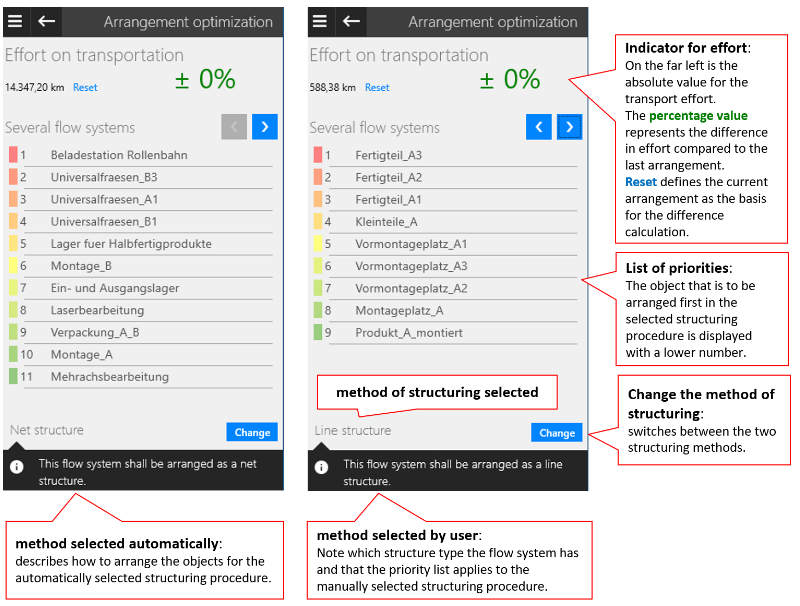
The efforts indicator provides the following information in real time:
- The absolute value of the efforts in transportation constitutes the aggregation of all products from the transport intensity and flow length for the selected flow system. The unit of the absolute value is displayed as follows, depending on the Intensity Measure:
- Transport flow (number of transports/a): Is displayed as a unit of length (m or km)
- Mass or volume flow (kg/a or m³/a): No unit specified
- Transport flow (number of transports/a): Is displayed as a unit of length (m or km)
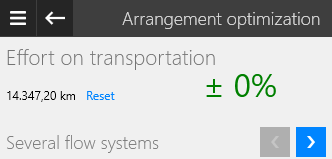
- The difference value specifies the change of the efforts in transportation relative to the absolute value at which the efforts indicator was last reset. Reductions in the efforts in transportation (negative difference) are visualized in green, as this is the desired control direction. Changes of the efforts in transportation are reflected by an increase (positive difference) and are visualized in red.
- The difference value can be reset to 0% either manually by clicking on
Resetor automatically:
- By calling the layout optimization function or
- When switching between the flow systems (if there are several flow systems).
- By calling the layout optimization function or
Procedural notes
visTABLE® supports the layout arrangement optimization for linear or networked material flow systems by creating and visualizing the arrangement priority. The structuring method used for this can be influenced under Options. Depending on this choice, the objective and the principle for optimizing the arrangement are explained very briefly in the black information text.
Here is the full version:
- The main objective for workshop and network structures is to minimize the overall expenditures (in accordance with Schmigalla).
The objective is to achieve that objects for which high efforts in transportation are to be expected are arranged as close as possible to each other in the layout. To this end, it is recommended to arrange the objects following the principle of an onion with the red objects (with high priority) arranged in the center, followed by the yellow and green objects. - As far as line structures are concerned, the reflows must be minimized.
The objects are prioritized thanks to this technique such that the number of reflows is reduced to a minimum when the objects are arranged a line. The priority corresponds to the position within the line structure, i.e. the red objects are to be placed rather at the beginning of the line or at other inputs, and the objects highlighted in green rather at the end of the line or at other inputs. It is not necessary to arrange the line strictly from the left to the right. It is also possible to arrange the line in the form of a U, in accordance with the priorities of the objects.
Selection of the structuring technique
The software always shows the priority list of the procedure for minimizing the transport effort (i.e. for network structures) when the arrangement optimization is called up or when the flow system is changed. This objective is usually pursued first and addressed as a priority with the effort indicator.
Priority list
The layout priority is visualized by way of a number and color; the color is also used in the Layout Area and in the visTABLE®3D view (where necessary) to highlight the appropriate layout object. The number, order and color result from the selected structuring technique:
- In the case of the network structure, the name of the layout or flow object is highlighted in red and can be found in the uppermost position, at position 1; this object is to be placed in the first position when a new layout is to be created. This is the object which in total carries the highest transport intensity and possesses the most flow relationships to other layout objects. The other flow objects are arranged beneath in accordance with the aforementioned criteria, incrementing the number of their priority. If objects are to be deemed equal, the same number and the same color are assigned.
- In the case of the line structure, the name of the layout or flow object is highlighted in red and can be found in the uppermost position, at position 1; this object represents the start of the line structure. The other flow objects in the line are arranged sorted in the list with incrementation of the number of priority. Equivalence is not visualized.
Practical tip
Click/tap on an entry in the priority list to select an object from the layout. Thus, the objects can be found faster and edited immediately (e.g. moving, rotating, changing properties).
Options
Since the minimization of the transport effort is usually pursued first and is also primarily addressed with the effort indicator, an alternative investigation of improvement options through linearization is usually of secondary importance. The layout optimization in visTABLE® takes this into account by offering the option of changing the optimization target and thus a different optimization method. To do this, open the Options expander at the bottom of the task area.
Follow the text instructions to exploit the full potential of arrangement optimization. The instructions and calculation options are offered depending on the structure type detected by the software. The following situations can be handled:
- The flow system follows a network structure, but the effect of linearization with the aim of a directed material flow must be investigated. In this case, the text in the expander
Optionswill indicate that a network structure has been detected. At the bottom there is an option to calculate the priority list for line structure. After pressing the corresponding button, the priority list and the colour image in the layout are calculated for a linearization, so that an arrangement can be easily achieved by moving the layout objects from red to green along a line. By selecting this option, however, you are pursuing a methodically inappropriate optimization goal, which is explained in the note text. You can therefore have the list calculated for the network structure again by clicking the button of the same name. This will take you back to the original priority list. - The flow system follows a line structure, but the procedure for minimizing the transport effort is set. In this case, the information text in the
Optionsexpander will indicate that a line structure has been detected. By clicking on theCalculate list for line structurebutton, you can now also display the priority list that matches the linearization and thus switch the colour image in the layout accordingly. If the reorganization of the objects in line results in a relevant deterioration of the transport effort, the priority list can be calculated again for network structure by using the button of the same name. This will take you back to the original priority list.
Procedure
Your task as a planner is to find a spatial structure for the objects or areas which requires e.g. efforts in transportation as little as possible. This constitutes a task of optimization.
You will be assisted by the Layout Optimization by way of heuristics. In other words: You - ideally as a member of a workshop team - must arrange the objects manually, based on appropriate information provided by way of the priority list and the coloring of the objects in the layout, which indicate how objects or areas are to be arranged relative to (in the vicinity of) other objects. The improvement or worsening of the spatial structure compared the previous arrangement is visualized by way of the efforts indicator above the priority list. Usually, iteration steps are required to achieve a good structure.
Building (planning) a new structure
- Block transport networks already defined from use in the
Material FlowTask Area. - Start the
Layout Optimizationdesign function from theTask Menu. - Check beneath the priority list which Structure Type has been identified and determine whether or not this corresponds to your expectations.
- The automatically selected Structuring Technique can be deselected where necessary by way of the
<or>button. The software will subsequently recalculate the priority list and change the coloring of the objects or areas in the layout. - Arrange the object with the highest priority in accordance with the selected Structuring Technique in the layout. Do this with the object with the second-highest priority, then with the third one, etc. Repeat this process until all objects of the list have been arranged accordingly in the list.
- Reset the efforts indicator and vary the arrangement in accordance with the selected technique in order to reach a better indicator. An improvement of the indicator is indicated by way of a negative sign since the efforts in transportation to be expected are lower.
Modifying (planning) an existing structure
Optimizing an existing structure
The two aforementioned Structuring Techniques are so-called arrangement techniques, i.e. they produce principally new arrangements. If these techniques are used for existing objects, new logistical and architectural structures may be required under certain circumstances. Due to the fact that such structures are usually fixed and can seldom be modified without great expenditure, they restrict attainment of the optimization target. In other words: An improved arrangement structure must also compensate the expenditure for restructuring; this requires even more comprehensive consideration when taking into account the existing logistics structure. Consequently, the layout optimization function must always be used with further design and evaluation functions of visTABLE®.
Do not use the Layout Optimization planning function in isolation for existing objects, but rather as an initial, rough analysis tool, for which purposes the coloring of the objects in the layout is decisive. Proceed as follows:
- Prevent the use of the transport networks in the
Material FlowTask Area and return to theLayout Optimization. - Note down the absolute value of the efforts indicator (not the percentage value).
- Now reactivate the use of the transport routes in the
Material FlowTask Area. - Start the
Layout Optimizationdesign function from the .Task Menuand note also down this absolute value of the efforts indicator. - Check to which extent layout objects of approximately the same size can be arranged by swapping the positions such that the relative vicinity of the objects results which is intended by the selected Structuring Technique.
- Complete the layout optimization once the efforts indicator has been significantly improved. Otherwise, deactivate the use of the transport routes in the
Material FlowTask Area and return to theLayout Optimization. Check the difference of the value noted down in step (2) and compare it to the displayed absolute value from step (6):
- If the value in step (6) < value in step (2), it might be worth optimizing the transport system further. Proceed with step (7).
- If the value in step (6) > value in step (2), swapping was not effective. Repeat the steps (3) to (6) where appropriate to perform new, more comprehensive movements.
- If the value in step (6) < value in step (2), it might be worth optimizing the transport system further. Proceed with step (7).
- Now reactivate the use of the transport routes in the
Material FlowTask Area and return to theLayout Optimization. - Use the Distance-Intensity Chart to identify the Flow Relationships with the greatest efforts.
- In some cases, it is possible to reduce the routes for the flows with the highest efforts which were identified in step (6) or Tansport Intensities by modifying the existing logistics (transport means, routes, batch sizes) or modifying the building (e.g. breakthroughs). If the efforts indicator cannot be increased compared to the value noted down in step (4), no improvement could be achieved by way of the modifications in the structure and logistics which have been performed to date. In this case, the structure of the layout of the existing objects need not be modified under the existing determinants (production program, resources, processes).
Several flow systems

In this case, there are Flow Systems that are independent of each other, i.e. the resources of the layout are not fully connected with each other by flows. Use the < and > buttons to navigate through the flow systems to display the appropriate structure type, the Priority List and the Structuring Technique recommended for the appropriate flow system. This is visualized in the layout correspondingly.
Practical tip
In many cases, several flow systems indicate that the logistic interrelation between the individual product flows is not complete. An arrangement of each flow system in its own layout area independently of other layout areas would indicate a complete segmentation of the production system. In most cases, the factory areas are related to each other at least via incoming and outgoing products warehouses so that independent flow systems typically do not occur in factory layouts.