The user interface of visTABLE®logix
Production Program
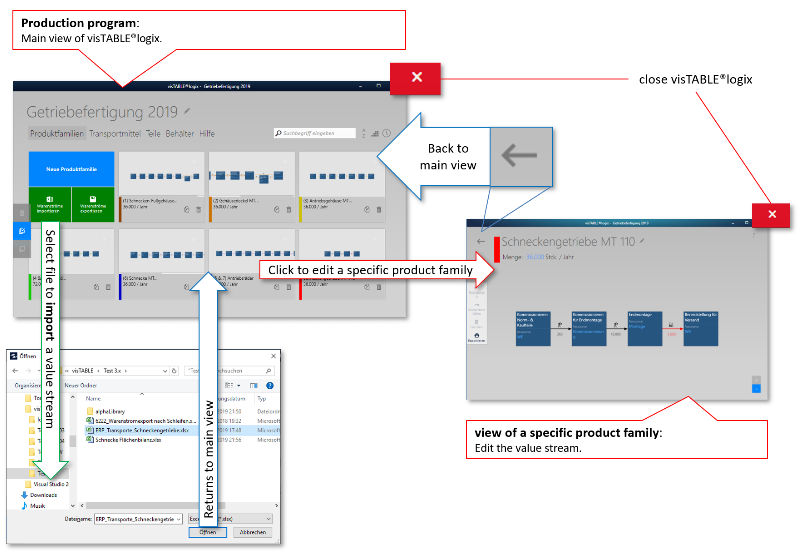
The user interface of visTABLE®logix provides two basic views:
- The
Production Program View(in the illustration shown on the left) provides an overview of the product families (represented with one thumbnail each for the product flow of the product family), a navigation bar, the menu, and a block of buttons to create, import and export product flows. - The
Production Program View(in the illustration shown on the right) provides possibilities for editing product families.

The two views can only be displayed alternatively. Left-click or tap on a thumbnail of a product family to call its view. To return from the Product Family View, use the gray arrow in the top left corner of the Production Program View. When you close one of the views by way of the Windows® cross, you will quit visTABLE®logix.
Updating the layout in visTABLE®touch
Changes in visTABLE®logix are displayed in the layout automatically when switching to the production program view or quitting the program. Saving the layout in visTABLE®touch will also save your changes (including those in visTABLE®logix) in the Layout Document.
The Production Program view
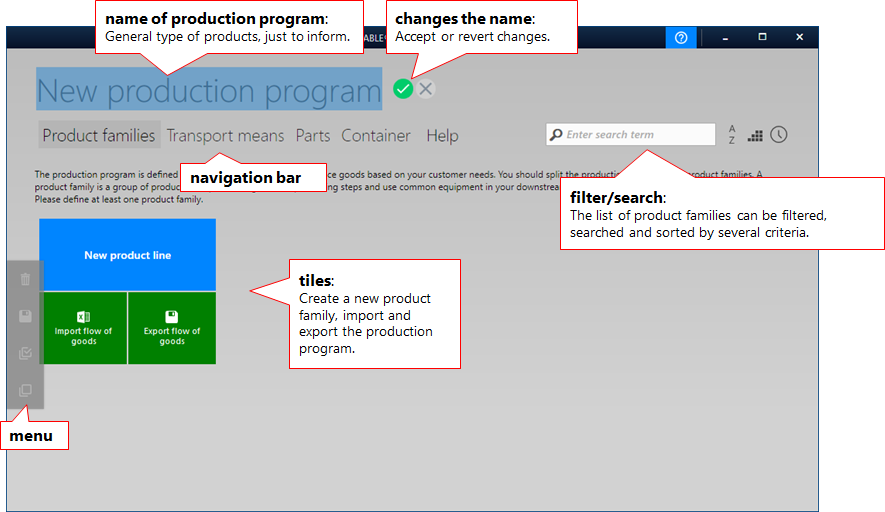
By default, visTABLE®logix starts with the Overview of the Product Families which is represented as follows:

- A designation of the production program is to be specified at the very top. When visTABLE®logix is started for the first time, the field already contains a default designation which is highlighted; hence, you can start with input immediately.
- Use the navigation bar to switch the overviews between the production program, the
- Product Family Overview,
- Overview of Transport Means,
- Parts and Container Overview (both empty by default), and
- homepage of the visTABLE®logix Help.
- Product Family Overview,
- The block of buttons is used to initiate the following actions:
New Product Familyis used to start theView Product Familyto create a new product flow chart.Import Product Flowsopens a Windows® dialog to select a data table in the XLSX format for import of movement data existing in the product flow format in Microsoft®Excel.Export Product Flowsopens a Windows® dialog to select a storage location for a data table in the XLSX format for export. Unless no Product Families are specified in visTABLE®logix, movement data in the format of the product flow are created for Microsoft®Excel.
After the product families have been created, you can use further functions of the product family overview.
The Product Family view
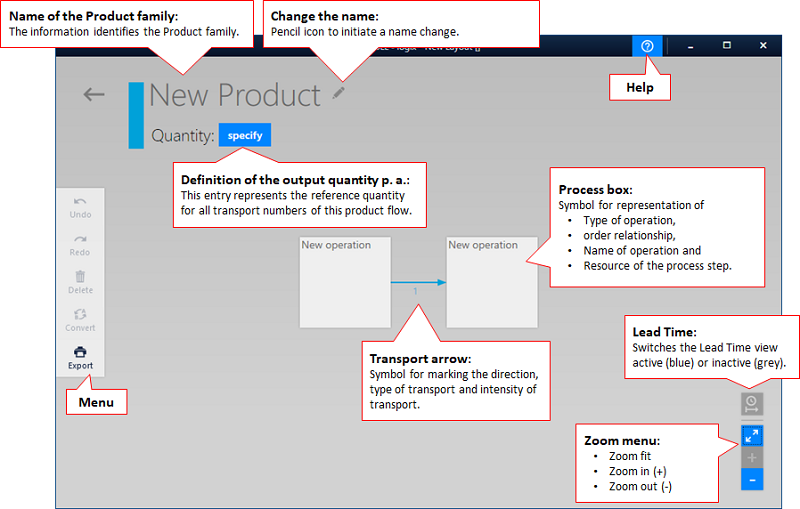
Left-click or tap on New Product Family to start the Product Family View. It can be used to acquire all information of a product family. If the view has never been started before, an animation on how the gesture control works appears. This help is intended for new users and can be permanently deactivated by setting the corresponding checkbox in the animation window.
At the beginning, there are two unspecified process boxes that are connected to an unspecified transport arrow.

- A Designation for the Product Family can be specified in the input field at the top.
- If a new product family is created, the
Specifyaction is displayed after quantity to initially specify the corresponding; if the quantity is already specified, the annual quantity is specified here. - The menu provides the following actions:
Undoa gesture when acquiring the product flow.Restoreactions that have been undone.Deletethe highlighted symbol in the product flow chart.Convertof process boxes with respect to their operation type (Storage vs. Transform).Exportthe complete product flow chart in the XPS or PDF format, e.g. for printing or display on a Windows® system. A Windows® dialog for selection of a storage location for the file is displayed.
- The Help context-sensitively opens a window or tab of the default browser installed on the system.
- The Zoom menu allows independent of the gesture control.
- Fit the graph into the window,
- Zoom in the view (+),
- Zoom out the view (-).
- The mouse scroll wheel can also be used to zoom.
- To move the section, the middle mouse button can be used.
- Fit the graph into the window,